
Bitcoin Price Prediction: CLARITY Setback, BTC Above $81K
Bitcoin has pushed back into focus this week, holding firm above a key psychological level even as regulatory headlines swirl around Washington.
The Bitcoin Price Prediction outlook has strengthened after BTC reclaimed the $81,000 mark alongside fresh news on the regulatory front from two of the country's top financial watchdogs.
Bitcoin, launched in 2009 as the first decentralized cryptocurrency, remains the largest digital asset by market value and continues to set the tone for the broader crypto market.
Bitcoin's price today is $81,239.59, up 3.9% over the past 24 hours, moving within a daily range of $77,933.54 to $81,674.72.
The coin carries a market capitalization of $1.632 trillion, matching its fully diluted valuation given its supply structure.
Live Market Data
Source: market data taken from CoinGecko, as of Sep 19, 2026. Figures may vary slightly across other tracking websites.
Bitcoin News Today
A widely followed crypto trader flagged a notable regulatory development this week, noting that the SEC and CFTC are continuing to push ahead with crypto rulemaking despite a recent setback tied to the CLARITY Act in Congress.
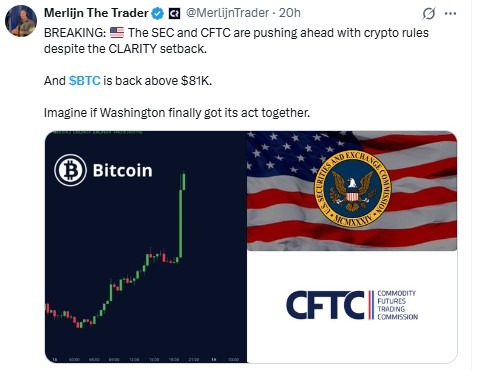
Source: Data Taken From @MerlijnTrader, X Account, as of Sep 19, 2026
The same post pointed out that BTC has climbed back above $81,000, framing the combination of price strength and regulatory progress as a sign that US policy on digital assets could finally be moving in a more coordinated direction.
While the CLARITY Act setback represents a real hurdle, the fact that both agencies are advancing separate rulemaking tracks is being read by some traders as a modestly bullish signal for bitcoin news today.
Technical Analysis
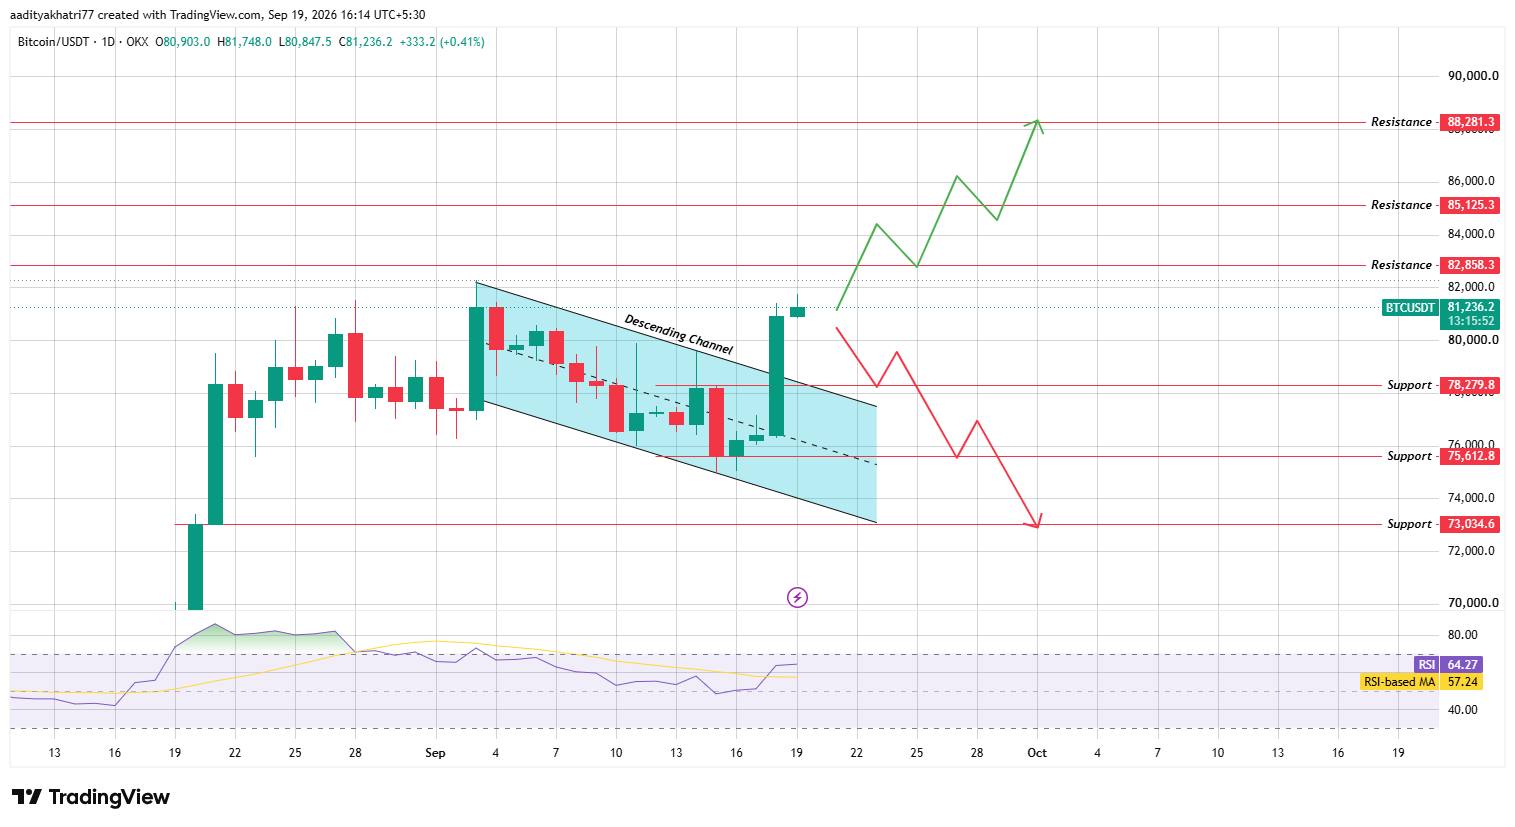
Bitcoin's daily chart shows the price breaking above the upper boundary of a descending channel that had been in place since late August, with the breakout candle carrying notably higher volume than the sessions before it.
Source: Chart taken from TradingView, as of Sep 19, 2026
The RSI reads 64.27, above its moving average of 57.24, pointing to strengthening momentum without yet reaching overbought territory.
Can BTC extend gains toward higher resistance?
If Bitcoin holds above the broken channel boundary and buyers keep stepping in on dips, price could work toward $82,858.3 first.
A confirmed close above that level would open the path to $85,125.3, with $88,281.3 as the next major resistance zone. This scenario would mark a meaningful extension of the current breakout.
What happens if BTC is rejected back into the channel?
A failure to hold current levels could send the price back toward $78,279.8 support.
A deeper pullback would bring $75,612.8 into focus, and a break of that zone could extend losses toward $73,034.6, the base of the prior channel structure.
Support and Resistance Levels
Bull, Base, and Bear Scenarios
Methodology
This BTC technical analysis is based on the daily BTC/USDT chart sourced from OKX via TradingView, with all levels measured against confirmed candle closes rather than intraday wicks.
Support and resistance zones were identified using prior price reactions on the same timeframe, and momentum readings reference the standard 14-period RSI alongside its moving average.
Regulatory context was cross-checked against current reporting before inclusion, keeping this Bitcoin price prediction grounded in verified data.
Expert Opinion
Market watchers following the breakout generally see the combination of a volume-backed channel break and continued regulatory engagement from the SEC and CFTC as constructive for near-term sentiment.
Several analysts caution, however, that the CLARITY Act setback shows Washington's crypto policy path remains far from settled, and a pullback to retest the former channel boundary as new support would strengthen confidence in the breakout holding.
Disclaimer: This article is for informational purposes only and does not constitute financial advice. Cryptocurrency markets are highly volatile, and price levels can move sharply in either direction within short timeframes. There is a meaningful probability that the price fails to reach the targets discussed above, including scenarios where the breakout fails and support levels break down. Readers should conduct their own research and consult a licensed financial advisor before making investment decisions.