Why Did XRP Jump Today Despite ETF Outflows? Eyes: $1.70
XRP is currently taking support from an ascending trendline on the hourly chart, and the price is holding right at that line rather than slipping away from it. Setups like this usually settle one way or another once a real close confirms the direction.
Here is what the chart, the fresh market data, and a new ETF update are showing right now.
Price Today: Live Data and 24-Hour Change
XRP is trading around $1.4206, up 6.36% on the day.
Market cap sits at $89.28 billion, open interest is at $3.19 billion, and activity remains strong, with 24-hour futures volume at $5.58 billion against $1.33 billion in spot volume.
The circulating supply stands at 62.87 billion tokens out of a total supply of 99.98 billion and a max supply capped at 100.00 billion.
Source: CoinGlass, data snapshot, September 19, 2026.
Latest News: Spot XRP ETFs See a Rare Outflow Day
According to a post from BSCN on X, spot XRP ETFs bled more than $5 million, with Ripple ETFs recording their first net outflow day of the week on September 17, losing $5.15 million in investor capital. 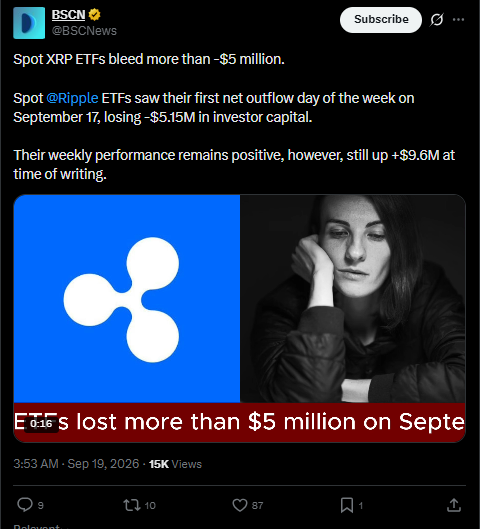
Even with that dip, weekly performance remains positive, still up $9.6 million at the time of writing.
A single outflow day after a strong week is not unusual and does not necessarily signal a shift in sentiment, but it is worth watching if the pattern continues into the next few sessions.
Source: BSCN on X, September 19, 2026.
Quick Take
CMP: $1.4213 on the 1-hour Binance perpetual chart
Bullish trigger: close above $1.4957, targeting $1.6991
Bearish trigger: close below $1.3411, targeting $1.2756
Data as of: September 19, 2026, 16:20 UTC+5:30
Risk note: a wick past either level counts for less than an actual closing confirmation, especially with price sitting right on the trendline
Technical Forecast: Reading the Ascending Trendline
Chart source: TradingView, 1-hour timeframe, Binance, September 19, 2026, 16:20 UTC+5:30. 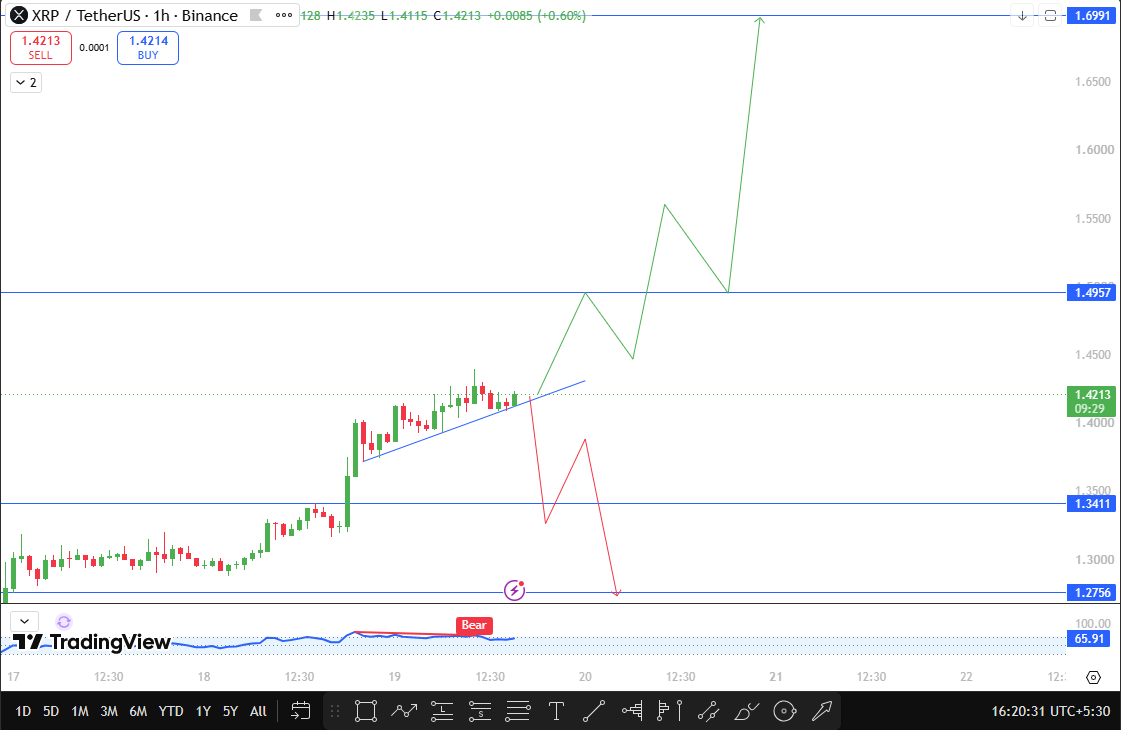
XRP is currently taking support from an ascending trendline that has guided this move higher, with price holding just above it rather than breaking down.
That makes this a real decision point for the next leg, since the line and current price are sitting almost on top of each other.
A close above $1.4957, about 5.23% higher than current levels, would confirm buyers are staying in control and open the path toward $1.6991, roughly 19.55% above CMP.
On the downside, a close below $1.3411, around 5.64% under current price, would suggest the trendline is losing its grip as support, putting $1.2756 in view next, about 10.25% below CMP.
Support and Resistance Levels
Bull, Base, and Bear Scenarios
In the bull case, a confirmed close above $1.4957 keeps the ascending trendline structure intact and opens a path toward $1.6991.
The base case has the price continuing to hold near the trendline without a clean close on either side, essentially consolidating right at this support test.
In the bear case, a close below $1.3411 confirms the trendline giving way, with $1.2756 as the next stop.
Risks to This Outlook
Trendline retests can produce false moves in either direction before the real breakout confirms, so a single wick should not be treated as a signal on its own.
The ETF outflow update is a genuine data point worth tracking, but a single day of redemptions after a positive week is not typically enough to shift the broader trend by itself.
Broader crypto sentiment, especially sudden Bitcoin moves, can also override this setup regardless of how the trendline plays out.
Glossary
Ascending trendline: a rising line connecting a series of higher lows, used to track the strength and direction of an uptrend.
Pattern trigger: the price level whose closing break confirms which direction a chart pattern is resolving.
Open interest: the total number of outstanding derivative contracts that have not yet been settled.
Disclaimer
This article is for informational purposes only and should not be considered financial advice. Price prediction figures and technical analysis shared here are based on chart patterns and publicly available data at the time of writing. Cryptocurrency markets are highly volatile, and prices can move sharply in either direction without warning. Always do your own research and consult a qualified financial advisor before making any investment decisions.