
Bitcoin Price Prediction: Why BlackRock Just Sold $144M in $BTC
Bitcoin just saw a big ETF flow reversal. A widely shared post flagged that BlackRock's spot BTC ETF clients sold $144.11 million worth of BTC, a notable shift after months of steady inflows.
This Bitcoin price prediction checks how that selling lines up with the chart and where it could go next? trading at $76,267.21, up 0.15% on the day
Bitcoin News Today: BlackRock ETF Clients Sell $144M in BTC
In today's crypto news, a report said BlackRock's spot BTC ETF clients sold $144.11 million worth of BTC.

Source: Data From X
We could not independently verify the exact outflow figure beyond what's stated in the post.
Technical Analysis: Channel and Downside Risk
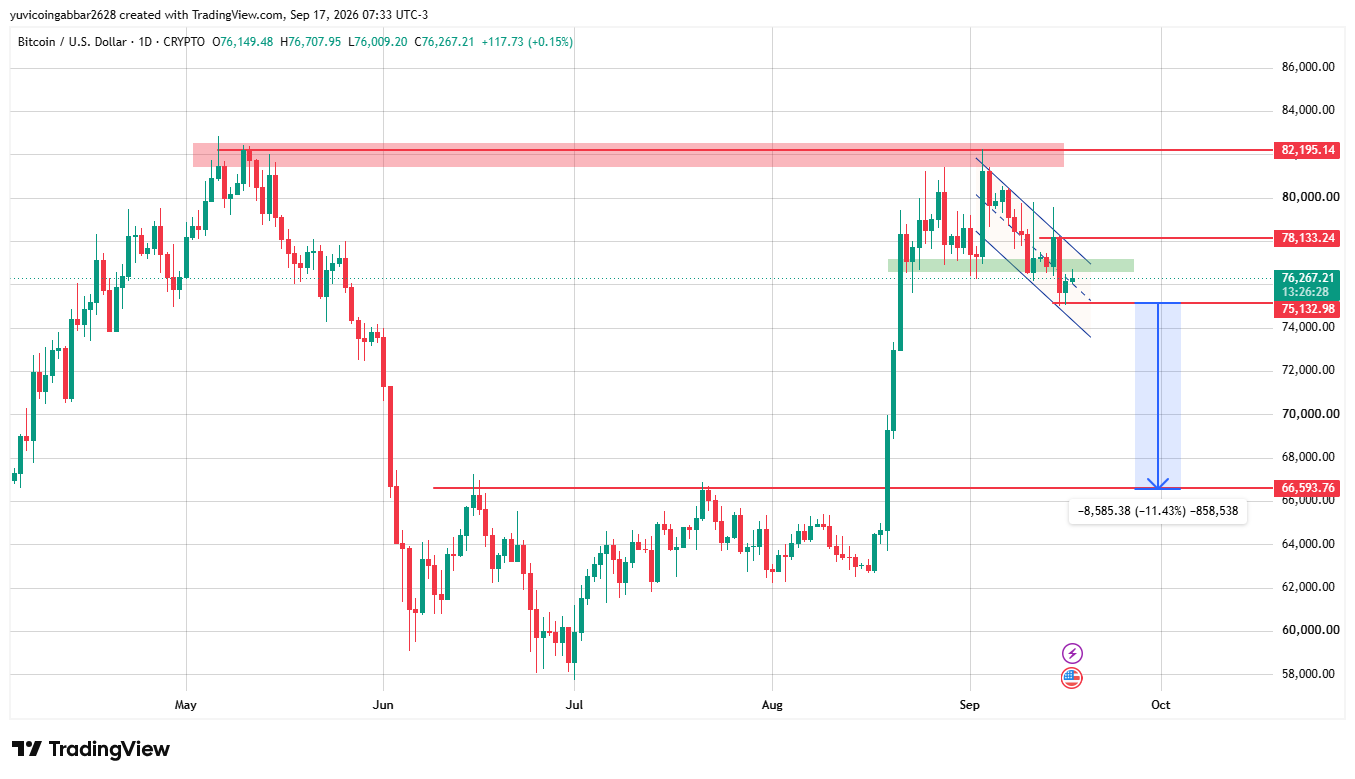
BTC is consolidating just below a major resistance zone at $82,195.14, a level that's already rejected price twice since early September.
After that rejection, it slipped into a descending channel, and the price is now at $76,267.21, sitting right at the lower edge of that channel near a support around $76,000 to $76,700.
The chart also marks a downside scenario: if this breaks lower, a move similar in size to its recent pullback, around 11.43%, could send the price toward $66,593.76, a level that acted as demand area back in June.
That's a projection based on the pattern, not a guaranteed outcome, and it would need a confirmed break below the current demand zone first.
Support and Resistance Levels
Bitcoin Forecast: Bull Case vs Bear Case
Bull case: Holding the $76,000 to $76,700 zone and reclaiming $78,133.24 would ease pressure from the ETF selling news and open the path back toward $82,195.14.
Bear case: A break below $75,132.98 would confirm the breakdown, and the chart's own projection points to $66,593.76 as the next level if that happens.
Can BTC Drop to $66,593.76?
$66,593.76 is the downside target the chart projects if the current channel breaks lower, based on a move of similar size to its recent pullback.
It's not close to happening yet; it would need to lose the $75,132.98 support first.
Bitcoin Price Prediction: Expert View
The BlackRock outflow adds a bearish headline right as it sits at the bottom of its channel, so the $75,132.98 is the level that matters most right now.
Losing it would validate both the chart's own downside projection and the ETF selling narrative.
Disclaimer
This is for informational purposes only, not financial advice. Levels and scenarios are based on chart analysis and public data at the time of writing, and crypto prices can move fast, so do your own research before acting on them.