Bitcoin Price Prediction: Can BTC Smash Toward $80K?
Bitcoin has spent the past two weeks grinding lower inside a tight, well-defined channel, and traders are now watching closely to see which side this bitcoin price prediction is on.
BTC remains the largest cryptocurrency by market value, with a hard-capped supply of 21 million coins that continues to underpin its long-term scarcity narrative.
The Bitcoin price today stands at $75,954.51, down 2.2% over the past 24 hours, with a market capitalization of $1.525 trillion.
Live Market Data
Source: market data taken from CoinGecko, as of Sep 16, 2026. Figures may vary slightly across other tracking websites.
Bitcoin News Today
According to BSCN, the U.S. Senate failed to invoke cloture on the CLARITY Act this week, falling 11 votes short of the 60 needed to open floor debate on H.R. 3633, with the final tally at 49 to 50.

Source: Data Taken From @BSCNews, X Account, as of Sep 16, 2026
Bitcoin dipped briefly under $75,000 following the result before recovering to around $76,000, ending the session down 3.79%.
The broader market felt the impact too, with the total crypto market capitalization slipping toward $2.59 trillion, a 3.63% decline.
This regulatory setback adds a layer of near-term uncertainty on top of the existing technical picture.
Technical Analysis
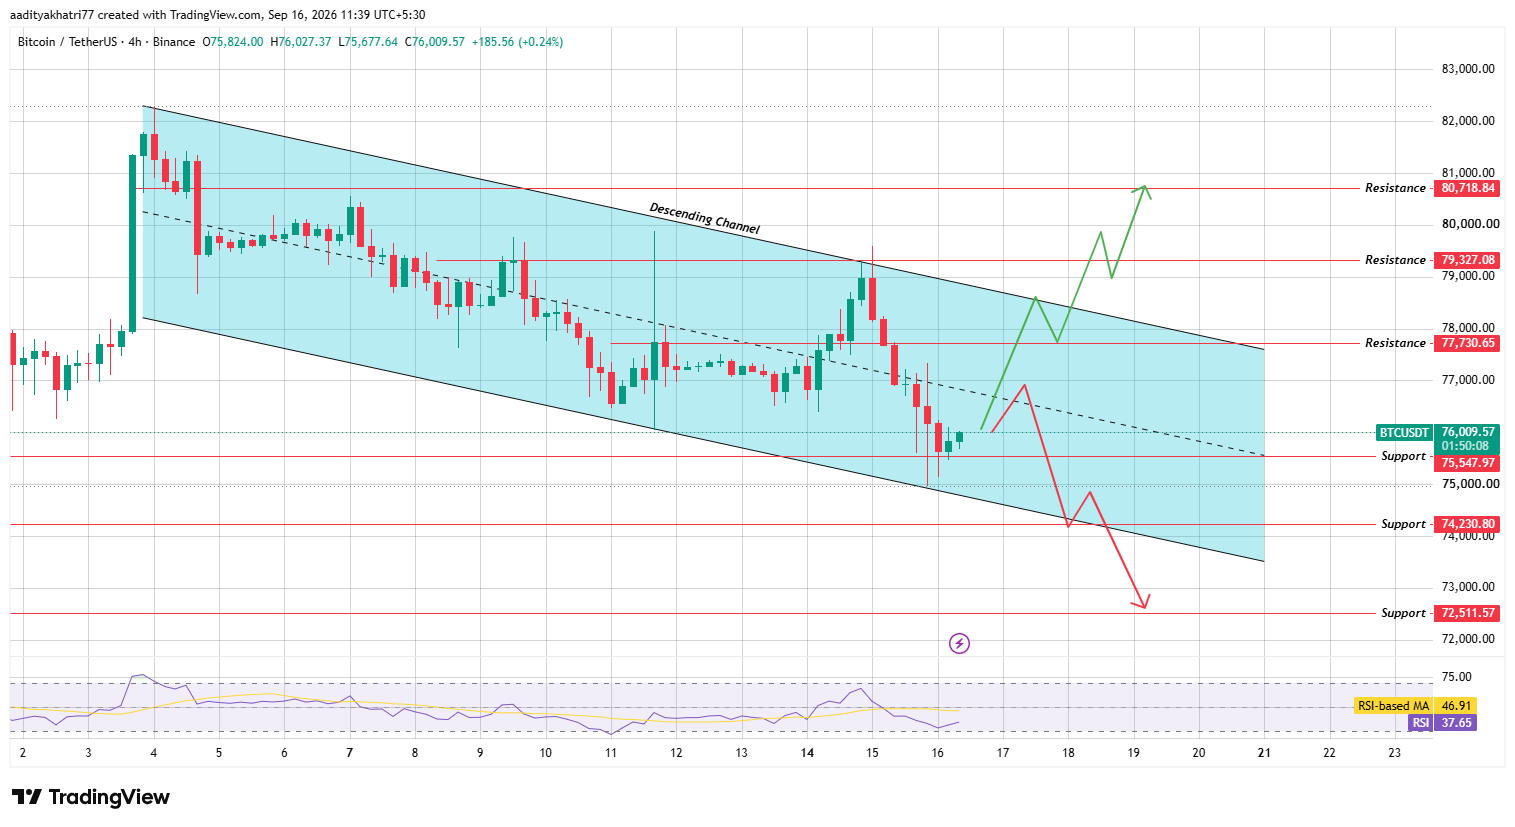
The 4-hour BTC/USDT chart on Binance shows the price contained within a descending channel that has held since early September.
. 
Source: Chart taken from TradingView, as of Sep 16, 2026
RSI sits at 37.65, below its moving average of 46.91, reflecting weak short-term momentum.
Can $BTC Break Above the Channel Resistance?
A confirmed 4-hour close above the channel's upper boundary and $77,730.65, supported by rising volume, would open a path toward $79,327.08.
Sustained buying beyond that level could push the price toward $80,718.84, a zone not tested since early September.
What Happens If $BTC Rejects the Bounce?
If the current bounce fails to hold and the price turns back down toward the channel's lower boundary, a break below $75,547.97 would shift near-term structure bearish.
That could send the price toward $74,230.80, with a deeper breakdown opening the door to $72,511.57.
Support and Resistance Levels
Bull, Base, and Bear Scenarios
Bitcoin and the Macro Backdrop
With no clear legislative timeline now in place, technical analysis may carry more weight than usual in the days ahead, as traders lean on chart structure while the policy picture stays unresolved.
Methodology
This Bitcoin Price Prediction is based on 4-hour chart analysis of the BTC/USDT pair sourced from Binance via TradingView, covering structure, RSI momentum, and defined support and resistance zones.
This analysis does not constitute financial advice.
Expert Opinion
Analysts tracking large-cap price action generally view a descending channel test following a negative news catalyst as a key signal, since it shows whether buyers can absorb legislative uncertainty or whether selling pressure extends further.
Disclaimer: This article is for informational purposes only and does not constitute financial advice. Cryptocurrency markets are highly volatile, and prices can move sharply in either direction. Support and resistance levels discussed here are technical estimates, not guarantees. Readers should conduct their own research before making investment decisions.