
Bitcoin Price Prediction: Is BTC Ready for a Reversal Toward $114K?
Bitcoin is sitting right at a level that has capped every recovery attempt for months, and this week's institutional selling has added a fresh layer of tension to the question of whether that ceiling finally breaks.
The outcome will shape near-term bitcoin price predictions september 2026 discussions across the market.
BTC remains the largest cryptocurrency by market value, and its price action continues to set the tone for the broader digital asset market.
The Bitcoin price today is $77,664.71, down 0.1% over the past 24 hours, having moved within a range of $77,321.31 to $79,529.96 during that period.
The current market capitalization is near $1.56 trillion, with a 24-hour trading volume of $31.403 billion.
Live Market Data
Source: market data taken from CoinGecko, as of Sep 15, 2026. Figures may vary slightly across other tracking websites.
Bitcoin News Today
Fresh institutional activity has added pressure to sentiment this week, with reports showing BlackRock ETF clients selling $19.23 million.

Source: Data Taken From @WhaleInsider, X Account, as of Sep 15, 2026
Outflows of this size from a major issuer tend to draw attention because they can signal short-term caution among larger holders, even when the broader trend remains unresolved.
The timing, right as the price sits near a key trendline, has made the sale a talking point alongside the technical setup itself.
Bitcoin Price Prediction: Technical Analysis
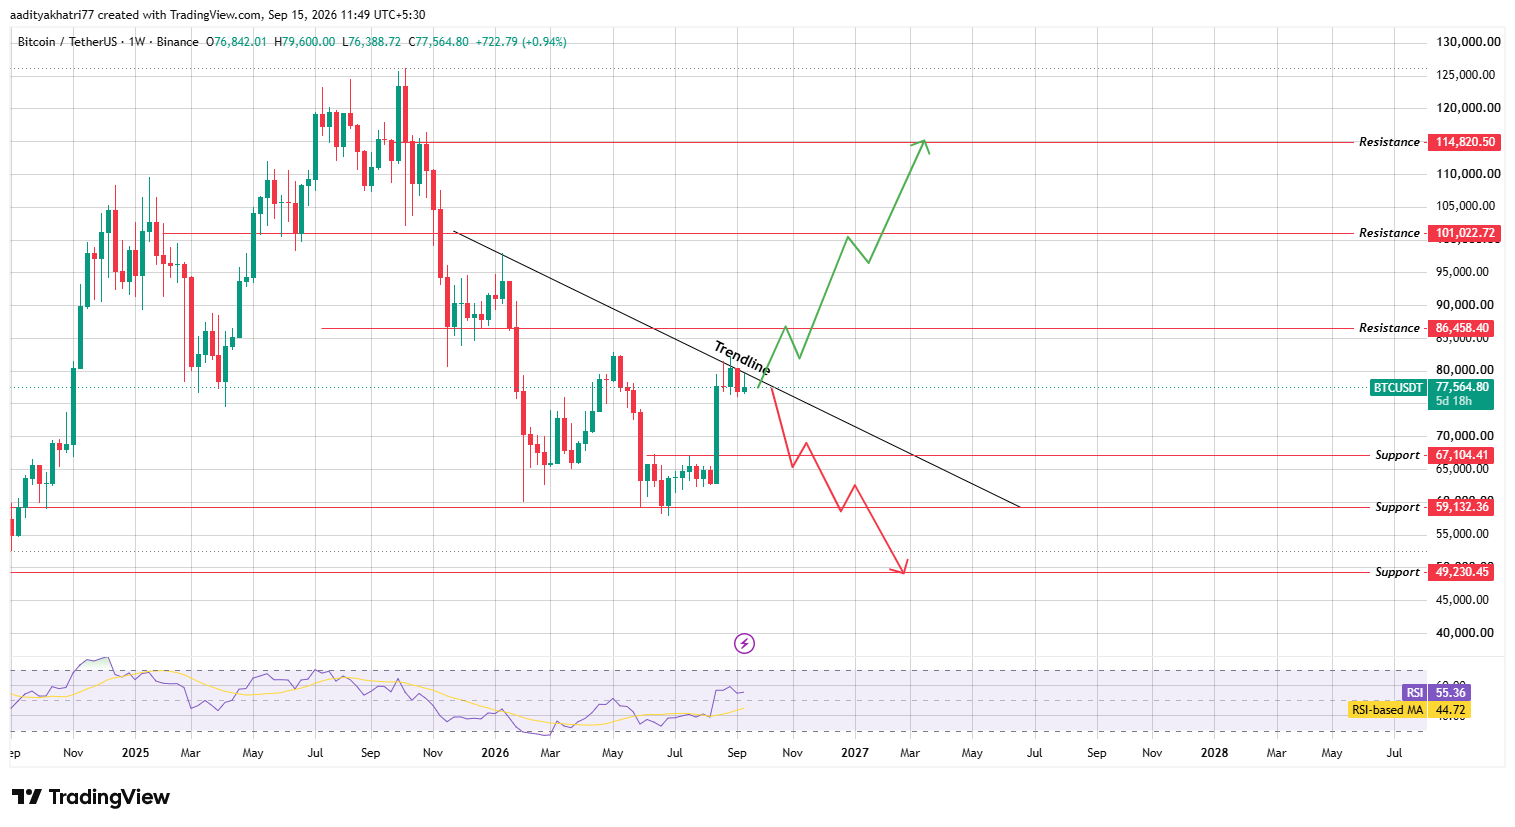
The weekly BTC/USDT chart on Binance shows the price sitting just below a falling trendline that has capped every rally since the recent highs.
Source: Chart taken from TradingView, as of Sep 15, 2026
The latest weekly candle is running at $77,564.80, up 0.94% for the period, with the Relative Strength Index at 55.36, above its 44.72 moving average, pointing to improving but not yet decisive momentum.
This trendline test is central to the current BTC price prediction, since a close through it on strong volume would mark a shift from the recent downtrend.
Can BTC Break Higher Toward $114,820?
A confirmed weekly close above the falling trendline, supported by rising volume, would open a path toward $86,458.40.
Clearing that level could extend gains toward $101,022.72, and a sustained move beyond that resistance would put $114,820.50 in view over time.
What Happens If BTC Gets Rejected
A rejection at the trendline, followed by a break of the $67,104.41 support, would shift the setup lower, with $59,132.36 and then $49,230.45 as the next bitcoin price levels to watch if selling pressure builds.
Support and Resistance Levels
Expert Opinion
Market commentary this week has focused on the BlackRock ETF outflow alongside BTC aproximity to its weekly trendline, with some observers describing the $19.23 million sale as routine profit-taking rather than a signal of broader institutional caution.
Others noted that a rejection at this trendline, especially so soon after fresh ETF selling, could reinforce short-term bearish sentiment if the $67,104.41 support also gives way.
The general view remains that a decisive weekly close, in either direction, will carry more weight for this bitcoin price prediction than the ETF flow data on its own.
Disclaimer: This article is for informational purposes only and should not be considered financial advice. Cryptocurrency markets, including BTC, are highly volatile, and the scenarios outlined above carry meaningful downside risk. Readers should conduct their own research and consult a qualified financial advisor before making investment decisions.