
Bitcoin Price Prediction: Whales Sit Tight Before BTC's Next Leg
Bitcoin was introduced in 2009 by the pseudonymous Satoshi Nakamoto as the world's first decentralized cryptocurrency, and it remains the largest digital asset by market cap to this day.
This Bitcoin price prediction comes at a time when whale activity has gone unusually quiet.
Bitcoin price today is $78,426.37, down 0.6% over the last 24 hours, with the price ranging between $77,832.79 and $79,701.36 during this period. The market cap stands at $1.575T.
Bitcoin Live Market Data
Source: BTC market data taken from CoinGecko, as of Sep 10, 2026. Figures may vary slightly across tracking platforms.
Bitcoin News: Whales Hold Steady Ahead Of Key Data
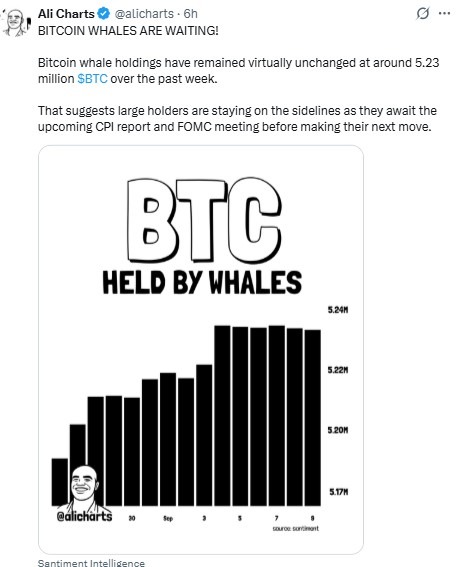
On-chain analytics account Ali Charts flagged something notable this week: large Bitcoin holders have barely moved.
Whale wallets have stayed parked around 5.23 million $BTC over the past seven days, a level of inactivity that suggests the market's biggest players are choosing to wait rather than act.
Source: Data Taken From @alicharts, X Account, as of Sep 10, 2026
The read here is fairly simple: with the CPI report and the upcoming FOMC meeting both on the calendar, whales appear to be holding their positions rather than adding or trimming exposure.
That kind of pause among large holders often lines up with periods of range-bound price action, which fits with what's showing up on the charts right now.
Bitcoin Price Prediction: Technical Outlook
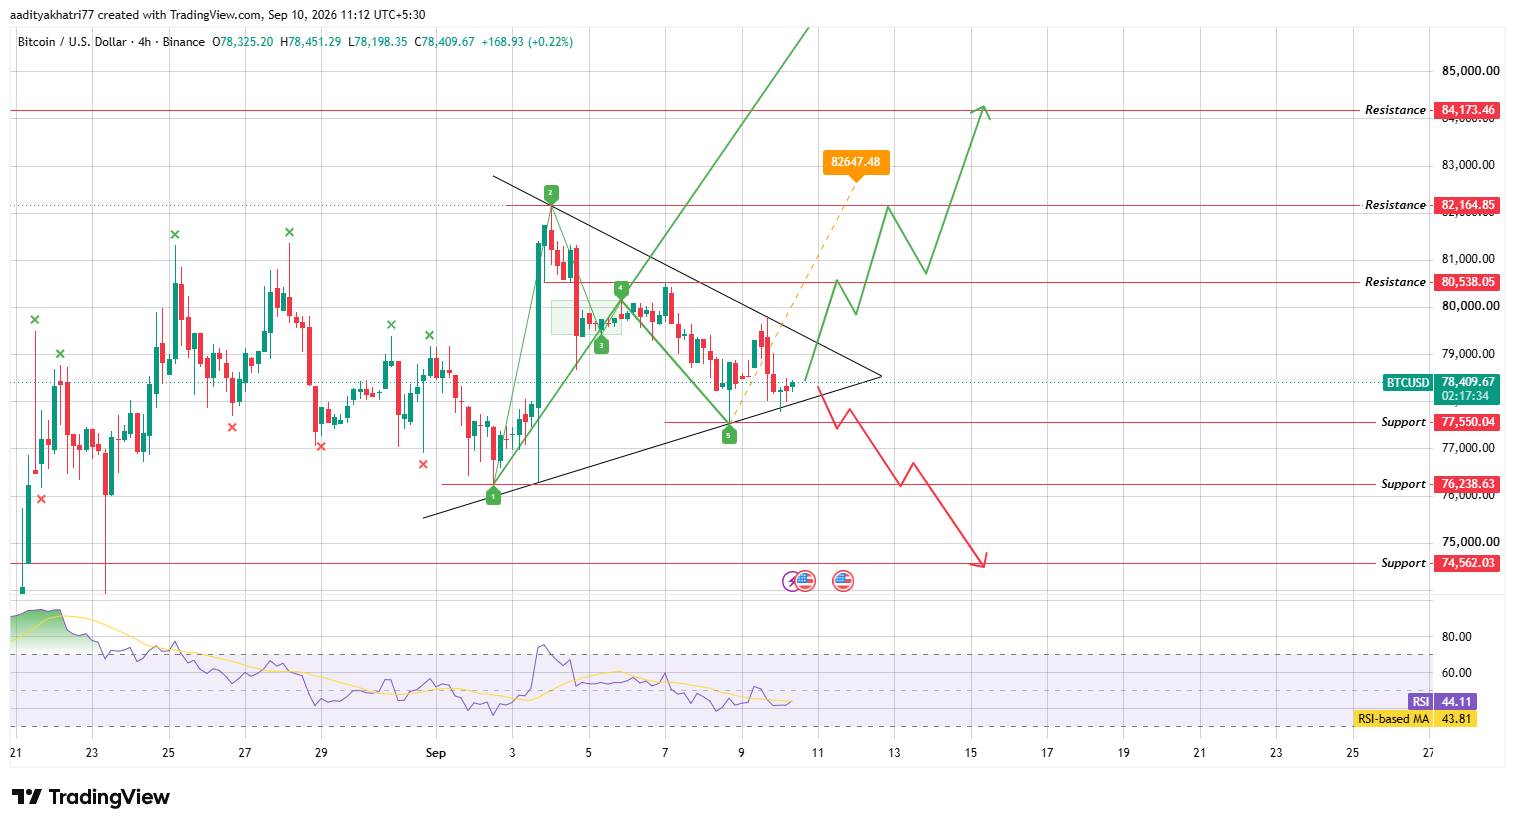
On the 4-hour BTC/USD chart, price is compressing inside a symmetrical triangle, with a falling trendline capping the top and a rising trendline supporting the bottom.
Source: Chart Taken From TradingView, as of Sep 10, 2026
$BTC last traded near $78,409, roughly in the middle of that squeeze.
A Wolfe Wave pattern layered onto the structure points to a projected target near $82,647 if the price resolves to the upside.
RSI is sitting at 44.11, just below its moving average of 43.81, reflecting the indecision baked into the current range rather than strong momentum in either direction.
Could BTC Break Toward Higher Resistance?
If the price bounces off the rising trendline and breaks above the falling trendline on rising volume, the triangle would resolve upward.
That would first bring $80,538.05 into focus, with $82,164.85 as the next hurdle and $84,173.46 as the wider resistance zone matching the Wolfe Wave's projected target area.
What Happens If BTC Breaks Down?
Flip the scenario, and a break of the rising trendline shifts attention to $77,550.04 as first support.
A close below that opens the door to $76,238.63, with $74,562.03 as the next major floor if selling pressure builds.
Support and Resistance Levels
Bull, Base, and Bear Scenarios
Expert Opinion
A symmetrical triangle this late in a trend is typically read as a decision point rather than a signal on its own; the breakout direction, not the pattern itself, is what matters.
With whale wallets frozen near 5.23 million BTC and the CPI report and FOMC meeting still ahead, traders are largely treating this as a wait-and-watch setup.
A volume-backed break in either direction is likely to carry more weight than usual once the macro data lands.
Disclaimer: This Bitcoin price prediction is for informational purposes only and should not be treated as financial advice. Cryptocurrency markets are highly volatile, technical patterns can fail to play out as expected, and any of the scenarios described above carry a realistic probability of not occurring. Readers should conduct independent research before making any investment decisions.