
XRP Price Prediction: Break This Level, or XRP Could Reverse
XRP has rallied sharply since late August, and the coin now sits right where those gains could either continue or unwind.
This is why the XRP price prediction for the coming weeks carries real weight, since Ripple is at a level that has decided its direction before.
The native token of the Ripple Ledger, a blockchain built to speed up cross-border payments between banks and financial institutions.
Ripple trades near $1.38, up 0.6 percent over the past 24 hours, with the XRP price today sitting near its highest levels in several weeks.
Live Market Data
Source: market data taken from CoinGecko, as of Sep 14, 2026. Figures may vary slightly across other tracking websites.
$XRP News Today
A widely shared technical take this week pointed to the $1.31 to $1.35 zone as the key support to watch, with the trader noting that a confirmed break above resistance near $1.38 could open the door toward $1.60.
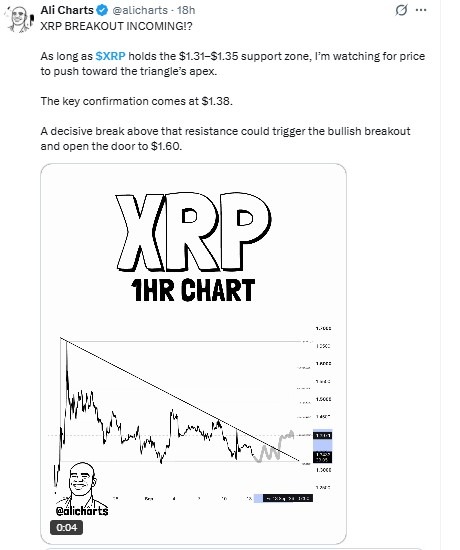
Source: Data Taken From @alicharts, X Account, as of Sep 14, 2026
This kind of news today reflects growing attention on Ripple current triangle structure, though the outcome still depends on whether price can close convincingly above resistance in the days ahead.
Technical Analysis
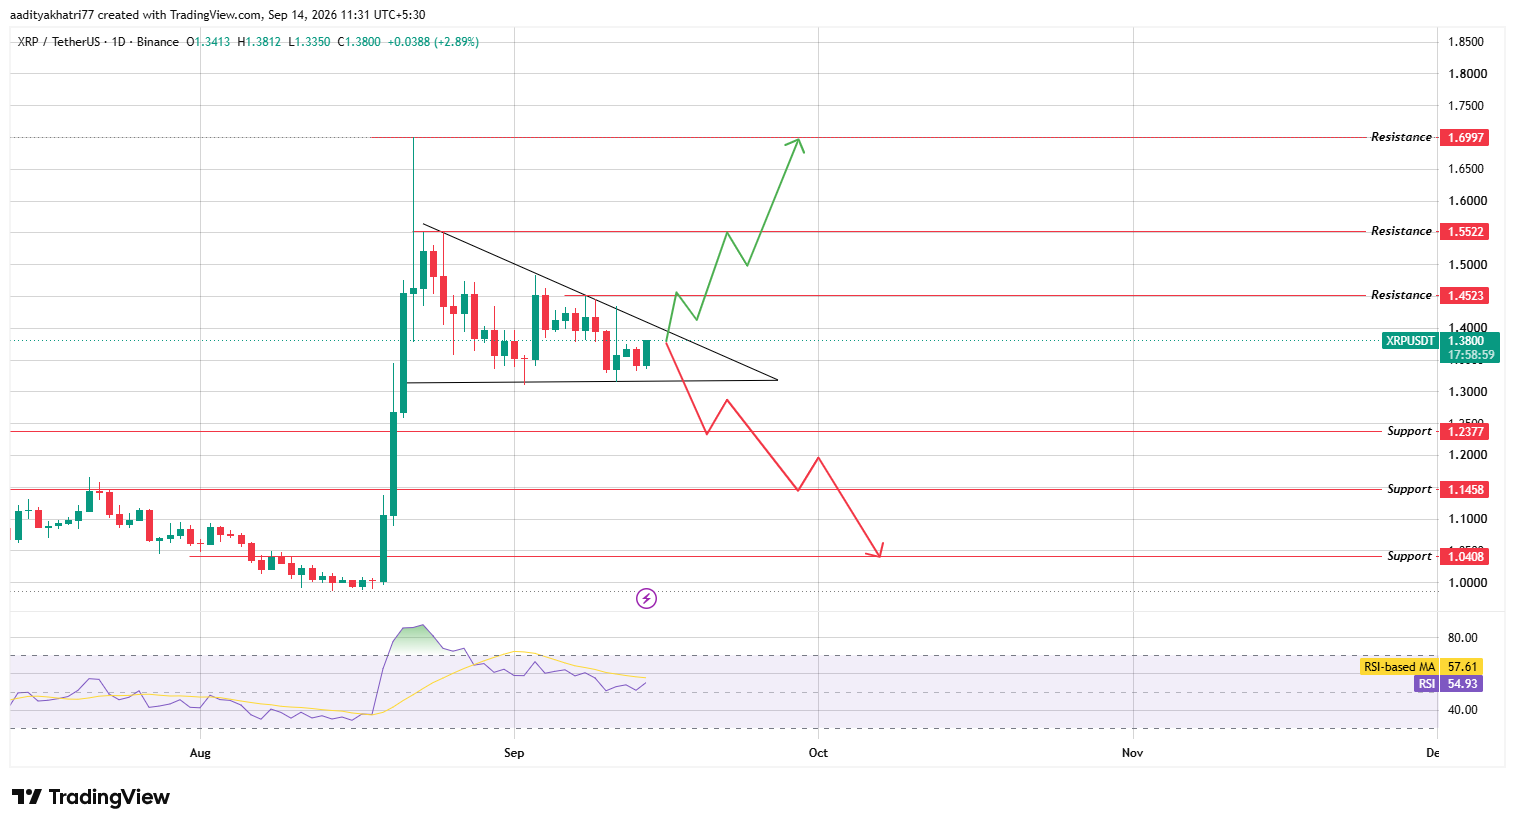
On the daily chart, $XRP is trading inside a descending triangle, formed by a falling trendline above and a flat support line below.
Source: Chart taken from TradingView, as of Sep 14, 2026
RSI sits at 54.93 with its moving average at 57.61, suggesting momentum is roughly balanced rather than one-sided.
This Ripple technical analysis setup means the next few daily closes could determine direction for weeks to come.
Can Break Above the Falling Trendline?
A daily close above the falling trendline, especially with rising volume, would confirm a breakout from the descending triangle.
That could push the price toward $1.4523 first, then $1.5522, and eventually toward $1.6997 on continued strength.
What Happens If It Loses the Flat Support?
If instead it fails to hold the flat support on a daily close, price could slide toward $1.2377, then $1.1458, and eventually toward $1.0408.
Support and Resistance Levels
XRP vs Bitcoin
Ripple price tends to get more room to run when Bitcoin holds steady or trends higher, since altcoin risk appetite typically improves alongside Bitcoin strength.
A sharp drop in Bitcoin would likely pressure triangle support faster than any Ripple Price Prediction based purely own chart could account for.
Methodology
This price prediction is based on the daily chart from Binance via TradingView, using the descending triangle structure, RSI readings, and the marked support and resistance levels.
No level discussed here should be treated as guaranteed.
Disclaimer: This article is for informational purposes only and does not constitute financial advice. Cryptocurrency markets, including coin, are highly volatile, and prices can move against any technical setup discussed here. Readers should conduct their own research and consult a licensed financial advisor before making any investment decisions.