

Bitcoin is stuck in a tug of war right now, and the next few days could decide who wins.
Traders are watching one number more than any other. Can Bitcoin push back above the $80K mark and actually hold it?
The past week brought mixed signals. Some encouraging, some not. This Bitcoin price prediction breaks down what the setup really says before that number gets decided.
ETF money that had flowed in for three straight days suddenly reversed course. And whale activity, war headlines, and a major custody filing all added noise to an already choppy chart.
So where does that leave the short-term outlook? We break down the immediate support, the resistance standing in the way, and what the current setup actually says about Bitcoin price prediction heading into the next stretch.
Bitcoin Price Prediction Today: What Traders Need to Know
As of 09:00 UTC on September 9, 2026, Bitcoin is trading near $78,880, up roughly 0.6% over the past 24 hours, according to live BTC price data.
Market cap sits near $1.58 trillion. 24-hour trading volume runs near $27.57 billion.
The current trend leans neutral. Daily momentum is cooling right under resistance, while the weekly trend is quietly trying to turn up.
RSI, or Relative Strength Index, a momentum gauge that flags overbought conditions above 70 and oversold conditions below 30, reads 61.29 on the daily and 57.16 on the weekly chart. Neither extreme.
MACD, or Moving Average Convergence Divergence, a trend tool that compares two moving averages, shows a shrinking histogram on the daily timeframe. That's a fading signal.
The weekly MACD histogram just turned positive for the first time in months.
Why Is Bitcoin Price Moving Today?
ETF Flows Are Shaping BTC Demand
Yesterday's flow flipped negative. Spot Bitcoin ETFs saw a net outflow of $46.65 million on September 8, breaking three straight days of inflows, per ETF flow data from SoSoValue.
BlackRock's IBIT still pulled in $10.66 million. But Grayscale's GBTC and Fidelity's FBTC bled money, down $65.51 million and $17.05 million, respectively.
Cumulative net inflow still stands at $55.57 billion. Total ETF assets are near $99.52 billion, about 6.31% of Bitcoin's entire market cap.
Institutions aren't panicking. They're rotating.
Fed and Inflation Expectations Remain Critical
The chain here matters. Inflation shapes what the Fed does next, Fed policy shapes bond yields, and yields shape risk appetite for assets like BTC.
When inflation runs hot, rate-cut hopes fade. And when rate-cut hopes fade, risk assets usually cool off first.
Bitcoin isn't detached from this cycle.
Geopolitical Risk Is Affecting Sentiment
Breaking headlines are stacking up fast.
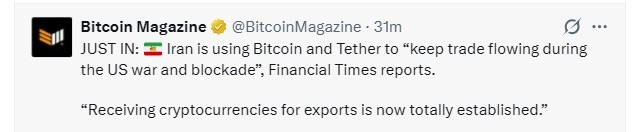
Iran is reportedly using Bitcoin and Tether to keep trade flowing during the ongoing US war and blockade, according to a Financial Times report cited by Bitcoin Magazine.
Separately, Jack Dorsey's Block just filed for a national trust bank charter, seeking OCC approval to custody BTC and stablecoins, joining Coinbase, Ripple, and Circle.

Two different stories. Both point toward Bitcoin's growing role beyond speculation.
Derivatives Positioning Looks Cautious
Open interest, the total value of outstanding futures contracts, sits near $53.65 billion, according to Coinglass derivatives data.
The long-short ratio on Binance reads 1.22, and OKX shows 1.24. Traders are leaning long, but not aggressively so.
24-hour liquidations hit $68.70 million, and longs took the bigger hit at $40.45 million versus $28.25 million for shorts. That tells us leveraged longs got flushed on the recent pullback.
Bitcoin Technical Analysis and Key Levels
BTC Support Levels
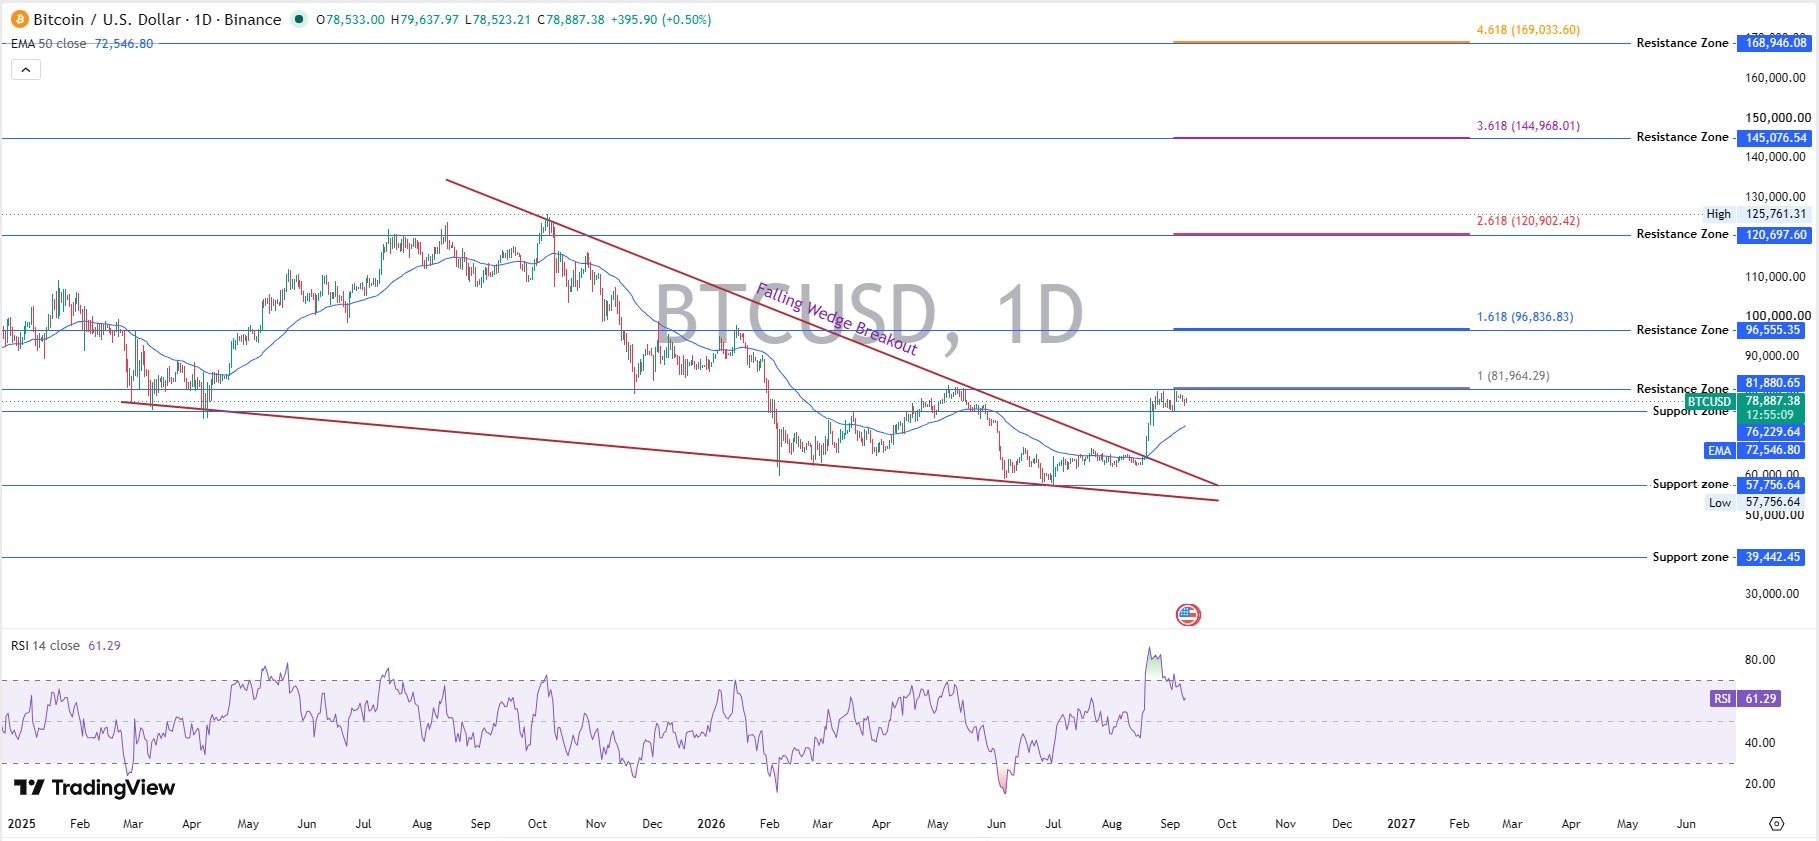
Immediate support sits near $78K, right around where BTC is currently trading.
Major support sits at $76K, matching the $76,229 zone where BTC has held $77K before during whale buying.
Structural support, the deeper floor from the weekly chart, sits near $57.7K, tied to the 0.618 Fibonacci retracement level. These zones line up with the live BTC chart rather than a single data point.
BTC Resistance Levels
First up is the $80K psychological level, the round number everyone's watching.
Above that sits the recent swing resistance zone around $81.9K to $82K.
Beyond that, $85K stands as the next major resistance, with the broader $96.5K zone waiting further out.
RSI and MACD
An indicator only matters if you know what it implies for price, not the number alone.
We pulled up the daily RSI and the first thing that stood out was room. At 61.29, momentum is intact but nowhere near overbought.
The weekly RSI, at 57.16, shows a healthier structure with no divergence warning yet.
MACD tells a different story depending on the timeframe. The daily MACD line sits below its signal line, with the histogram at negative 461, a bearish crossover forming right under resistance.
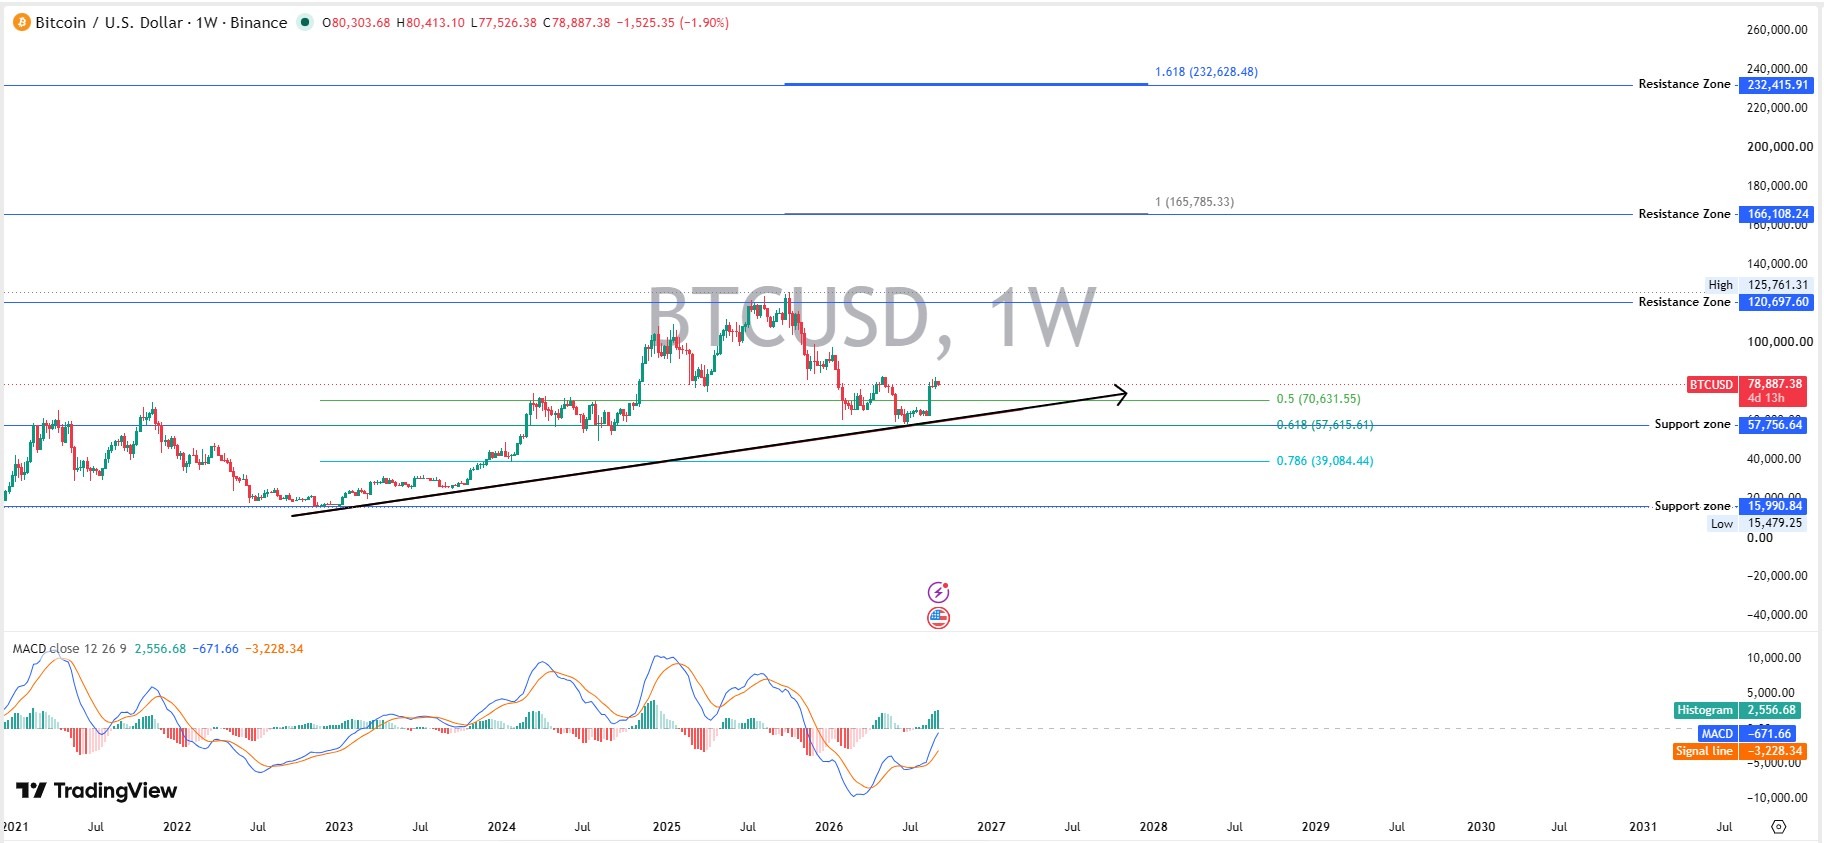
The weekly MACD paints a more hopeful picture. Its histogram just crossed into positive territory at 2,556, even though the MACD line itself remains below zero.
This looks bullish on the surface. Actually, wait, the daily histogram says otherwise.
Bitcoin Breakout Setup
A confirmed breakout needs a daily trading session finishing above $82K, not just an intraday wick through it.
Volume should expand alongside that move, ideally above the recent average, to confirm real buying pressure rather than a thin push.
If that happens, the next target opens toward $85K to $90K. Traders chasing similar early momentum elsewhere often track new crypto ICO listings during phases like this.
Bitcoin Breakdown Risk
The level that changes the bullish thesis is $76K.
A daily session trading and finishing below that zone would open the door toward $74K and eventually the $70.6K area on the weekly chart. Here's what typically happens once BTC falls below key support.
A break of $76K isn't a dip to buy blindly. It's a structural warning. Cautious traders sometimes rotate into vetted crypto IEO platforms when majors like BTC show weakness.
Bitcoin Price Prediction for the Next 7 Days
For a deeper read on where momentum stands right now, check the latest crypto news.
Bitcoin Price Prediction for the Next 30 Days
Bull Case: BTC needs a clean trade above $82K with ETF inflows turning positive again. That combination could carry the price toward $90K, approaching the $96.5K resistance zone.
Base Case: Most likely, BTC keeps chopping between $74K and $82K while the market waits on Fed signals and ETF direction.
Bear Case: Renewed ETF outflows plus a loss of $76K support could drag price toward $70.6K.
Invalidation: The bullish 30-day setup is invalidated if BTC trades below $74K on strong volume. Investors seeking earlier-stage exposure sometimes track new crypto presale rounds alongside BTC's range.
Bitcoin Price Prediction for September 2026
Other trackers have floated targets in the low-to-mid $80Ks for this month. We calculated ours independently from the live chart rather than borrowing anyone else's numbers.
Altcoin rotation this month has also kept crypto IDO launches active alongside BTC's chop.
Bitcoin Price Prediction 2026 to 2030
Long-range numbers are always speculative. Treat this table as a framework, not a promise.
Browse the full crypto categories hub for shorter-term updates as this structure develops.
Bitcoin Price Prediction 2026: BTC could dip to $57K on weak demand, hold near $85K in a normal market, or push to $121K if ETF inflows accelerate.
Bitcoin Price Prediction 2027: A bear cycle drags BTC to $65K, base case sees $100K on steady adoption, bull case hits $145K with strong institutional buying.
Bitcoin Price Prediction 2028: BTC risks $75K if macro conditions worsen, $120K looks likely in a balanced market, and $170K is possible on a supply-driven rally.
Bitcoin Price Prediction 2029: Downside support sits near $85K, base case targets $140K with continued growth, bull case reaches $200K on mainstream demand.
Bitcoin Price Prediction 2030: Worst case BTC holds $95K, base case lands at $165K as adoption matures, bull case tops $232K if scarcity drives a major breakout.
What Could Drive the Bull Case?
ETF demand accelerating again
Institutional adoption, including new custody players like Block, alongside growth across leading crypto blockchains
Deep liquidity returning to spot markets
Friendlier monetary policy
Bitcoin's fixed supply dynamics tightening further
What Could Trigger the Bear Case?
Persistent inflation delaying rate cuts
Restrictive monetary policy dragging on
Sustained ETF outflows
A geopolitical shock rattling risk appetite
A major technical breakdown below structural support
Bitcoin Price Prediction: Bull, Base and Bear Scenarios
*Probabilities here are analytical estimates from current chart structure, not statistical certainty.
Bitcoin Whale Activity, ETF Flows, and On-Chain Signals
Institutional treasury holdings alone account for roughly 1.34 million BTC, based on CoinMarketCap treasury data. That's a meaningful chunk of circulating supply sitting in long-term hands.
Whale accumulation has been a recurring theme lately, and it lines up with the dip-buying pattern seen near current support levels.
ETF flows remain the cleanest real-time proxy for institutional demand, and right now they're mixed rather than one-directional.
Long-term holder behavior and stablecoin liquidity matter too, though both move slower than price.
Bitcoin Price Prediction Risks to Watch
Fed policy shifts and inflation surprises
Geopolitical escalation, including the Iran situation
Renewed ETF outflows
Excess leverage building back up in futures markets
Liquidation cascades triggered by fast moves
Loss of the $76K major support zone
Unexpected regulatory developments around custody and stablecoins
Bitcoin Trader Takeaway
Keep this simple.
Above $82K: bullish continuation toward $85K and beyond.
Between $74K and $82K: range and consolidation, no strong edge either way.
Below $74K: bearish invalidation, structural weakness confirmed.
That's a far more useful framework than just saying BTC is bullish or bearish.
Let the levels do the talking from here.
Disclaimer
This article is for informational purposes only and does not constitute financial, investment, or trading advice. Cryptocurrency markets are highly volatile, and prices can change rapidly. All price levels, targets, and scenarios mentioned here are analytical estimates based on available chart data and should not be treated as guarantees. Readers should conduct their own research and consult a qualified financial advisor before making any investment decisions.