
Bitcoin Price Prediction: Is $90K Next for Bitcoin Now?
Bitcoin has extended its rally today, holding above a rising trendline while fresh institutional buying adds momentum.
This bitcoin price prediction breaks down the setup and the inflow data behind it.
As the largest cryptocurrency by market cap, the asset serves as the benchmark for the broader digital asset market.
Bitcoin's price today stands at $85,850.59, up 2.3% over the past 24 hours, with market capitalization at $1.724 trillion.
Live Market Data
Source: market data taken from CoinGecko, as of Sep 22, 2026. Figures may vary slightly across other tracking websites.
Bitcoin News Today: Near $1 Billion In ETF Inflows
According to Whale Insider, BlackRock and other spot ETF issuers recorded a combined $998.95 million in inflows, one of the largest single-day totals in recent weeks.

Source: Data Taken From @WhaleInsider, X Account, as of Sep 22, 2026
This scale of institutional buying adds fundamental support to the rally beyond the technical structure alone, and the timing lines up closely with today's move toward resistance.
Technical Analysis
On the 4-hour chart, price has climbed steadily above a rising trendline since mid-September, following a sharp move up from the $78,000 zone.
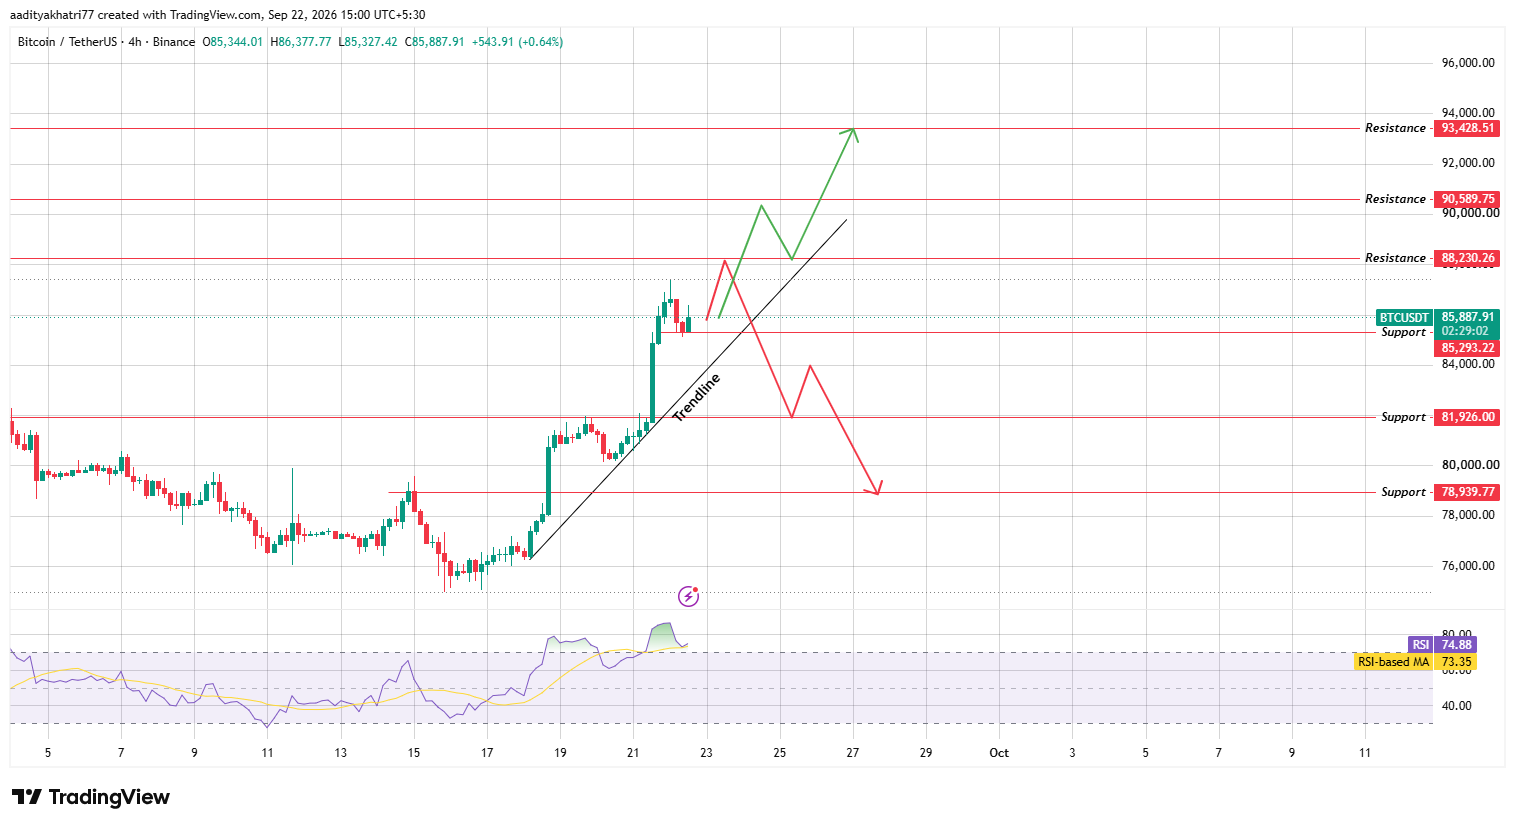
Source: Chart taken from TradingView, as of Sep 22, 2026
RSI now sits at 74.88, above its moving average of 73.35, placing the asset in overbought territory even as the broader trend stays upward.
Bullish case: A break above $88,230.26 opens the path to $90,589.75, with continuation possible toward $93,428.51 if buying pressure holds.
Bearish case: A rejection at resistance followed by a breakdown would expose $85,293.22, then $81,926.00, with further weakness risking a drop to $78,939.77.
Support and Resistance Levels
Bull, Base, and Bear Scenarios
Methodology
This analysis uses 4-hour candlestick data from Binance via TradingView, combined with live data from CoinGecko.
Levels are drawn from the structure visible on the chart, with RSI used to gauge momentum. Data reflects September 22, 2026.
Expert Opinion
Analysts tracking institutional flows note that inflows nearing $1 billion often precede sustained buying pressure, especially alongside a confirmed technical setup.
Whether the rally extends toward $93,428.51 depends on the trendline holding through any near-term pullback.
Disclaimer: This article is for informational purposes only and should not be considered financial advice. Cryptocurrency markets are highly volatile. Scenarios above are based on chart patterns and are not guaranteed outcomes. Readers should conduct their own research.