
Bitcoin Price Prediction: What Cramer's Exit Means for BTC
Bitcoin, the original cryptocurrency launched in 2009, remains the largest digital asset by market capitalization and continues to set the tone for the broader crypto market.
This Bitcoin price prediction looks at where $BTC stands today after its latest breakout and what the daily chart suggests comes next.
BTC is trading near $83,836.95, up 3.28% on the latest daily candle, with the token's market capitalization sitting close to $1.664 trillion.
The move follows weeks of sideways trading inside a defined consolidation box.
LiveData
Source: data taken from CoinGecko, as of Sep 21, 2026. Figures may vary slightly across other tracking websites.
BTC News Today
A widely shared post from crypto commentator Ash Crypto noted that BTC has climbed 31% and roughly $19,500 since Jim Cramer publicly said he was selling all of his Bitcoin, with the post jokingly crediting Cramer for ending the bear market.

Source: Data Taken From @AshCrypto, X Account, as of Sep 21, 2026
While the commentary is lighthearted rather than a serious market signal, it reflects the bullish sentiment that has built up around recent price action.
Technical Analysis
On the daily chart (Binance, candle closed 14:19 UTC+5:30, September 21, 2026) shows the price breaking above a consolidation box that had contained trading since late August.
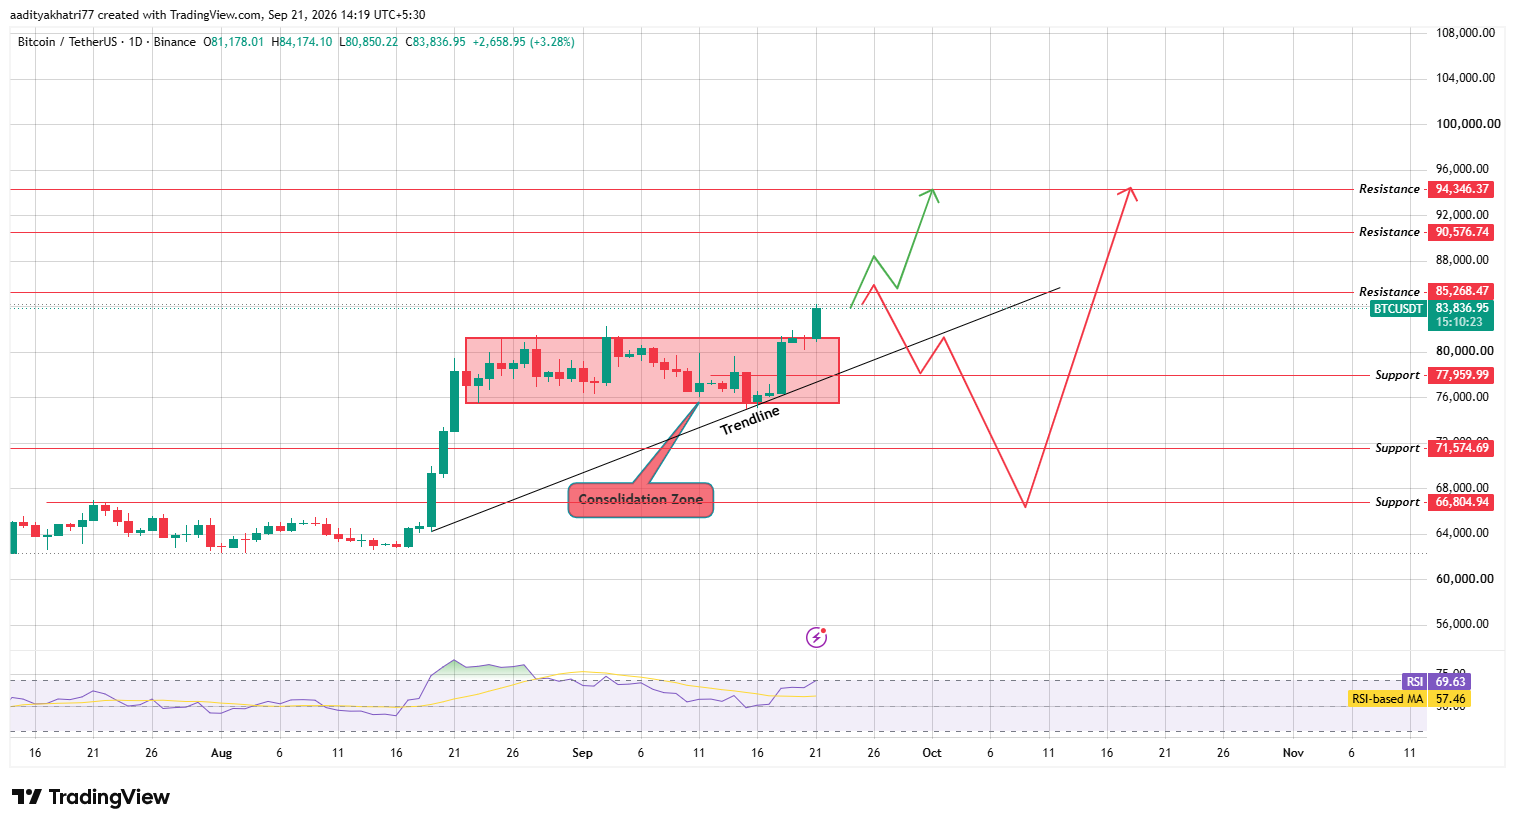
Source: Chart taken from TradingView, as of Sep 21, 2026
The RSI reads 69.63, well above its moving average of 57.46, confirming strong bullish momentum behind the breakout.
Bullish Case On Continued Strength
If it holds above the breakout zone near $85,268.47, the next resistance to watch is $90,576.74.
A daily close above that level on strong volume would open the path toward $94,346.37, extending the current rally to a fresh multi-week high.
Bearish Case on a Rejection
A rejection from resistance would send back toward the trendline that supported the recent consolidation.
Losing that trendline puts $77,959.99 support in focus, and a break there opens a path toward $71,574.69, with $66,804.94 as the next major level if selling pressure extends.
Support & Resistance Levels
Bitcoin vs Broader Crypto Market
As the largest asset by capitalization, the bitcoin price today typically sets the direction for altcoins rather than following them.
A sustained breakout here would likely give risk appetite across the broader room to extend, while a rejection could pull liquidity back toward BTC as a relative safe haven within crypto.
Disclaimer: This article is for informational purposes only and does not constitute financial advice. Cryptocurrencies are highly volatile, and prices can move against any technical setup discussed here. Readers should conduct their own research and consult a qualified financial advisor before making investment decisions.