
Solana Price Prediction: Most Bullish Rally
$SOL just closed its first green monthly candle in 10 months, and traders are calling it one of the most bullish setups in crypto right now.
Monthly RSI has broken a two-year downtrend, and fresh buying interest is showing up too. Fundstrat-linked firm just backed an $11M offering with proceeds earmarked to buy now.
This Solana price prediction looks at whether the reversal has legs. Here's what the chart shows.
Market data was checked on September 9, 2026, at 08:26 UTC-3.
Solana Price Prediction Today: Market Overview
Source: Data from CoinMarketCap as of September 9, 2026, at 08:26 UTC-3. Figures may vary slightly across other tracking websites.
Solana Crypto News Today: A Multi-Timeframe Bullish Setup
A widely shared post on X pointed out three signals lining up at once: $Solana just closed its first green monthly candle in 10 months, monthly MACD is close to a bullish cross, and monthly RSI has broken a two-year downtrend.
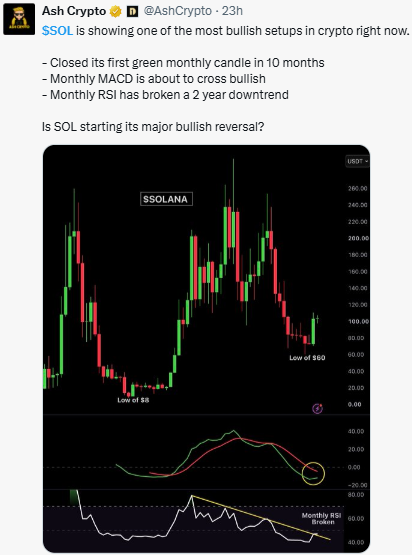
The post asked whether this marks the start of a major reversal, a question now shaping the current Solana price prediction outlook.
$SOL Price Prediction: Fresh Institutional Buying Interest
A separate post flagged that the chairman of an Ethereum treasury firm took part in an $11M digital credit offering from DeFi Development Corp, the first $SOL-backed instrument of its kind, with proceeds set to buy.

Source: Data From X
The move was read as a possible sign of capital rotating toward , adding another layer to the current $SOL price prediction narrative.
$SOL Price Prediction Chart: Technical Analysis
Pair: $SOL/USD · Market: Spot (Crypto) · Exchange: Composite · Timeframe: 1D · Source: TradingView (EMA) · Timestamp: September 9, 2026, 08:26 UTC-3
$Price is trading at $103.68, up 0.32% on the day, holding inside a rising channel after a sharp August rally off lows near $80.
Price is sitting above both EMAs, with EMA20 at $99.28, which lines up with a key support zone, and EMA50 further below at $90.52.
Holding this structure keeps the broader bullish setup from the monthly chart intact on the daily timeframe too.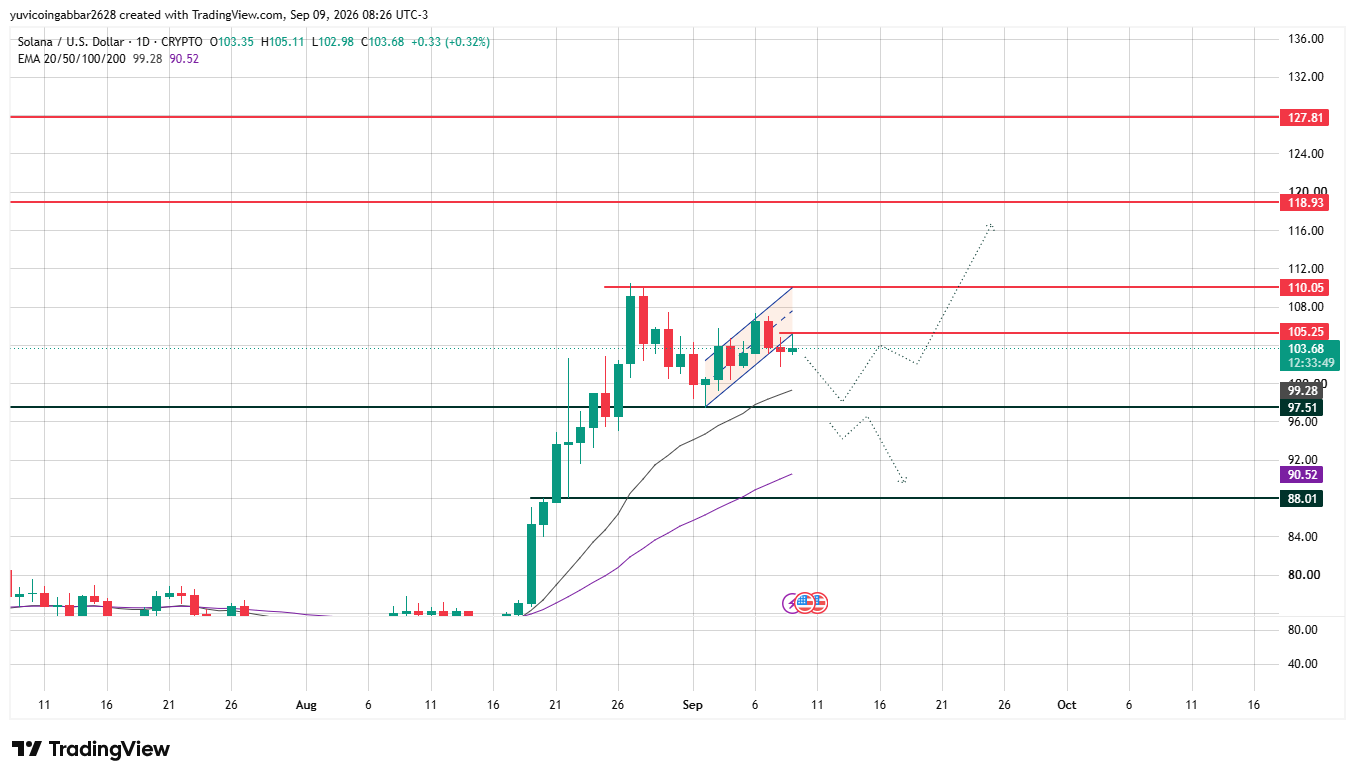
Support and Resistance Levels
Solana Price Forecast: Bull Case vs Bear Case
Bull case: Holding above the EMA20 support zone at $99.28 and clearing the nearest resistance at $105.25 keeps the reversal thesis alive, with $110.05 and $118.93 as the next stops if buying pressure continues.
Bear case: A close back below $99.28 would put the reversal setup in doubt. Losing $97.51 would expose EMA50 at $90.52, with the structural floor near $88.01 below that.
$SOL Price Prediction: Triggers and Invalidation Levels
Can $SOL Reach $118.93?
$118.93 is the highest near-term resistance marked on the chart.
Getting there would require $SOL to clear $105.25 and $110.05 first, a move that would likely need the monthly reversal signals to keep confirming rather than fade.
Price Forecast and Outlook
$SOL's first green monthly candle in 10 months, paired with fresh capital interest, gives this rally more backing than a typical bounce.
The Solana price forecast stays constructive while price holds above $99.28, with $105.25 and $110.05 as the next levels to watch. A pullback toward the EMA zone wouldn't be unusual even within a healthy reversal.
Price Prediction 2026: Expert View
Multiple monthly signals turning bullish at once is rare, and $99.28 is the level that decides if this reversal holds. Watch that zone closely.
Disclaimer
This piece is for informational purposes only and isn't financial advice. Crypto markets can move sharply, and past patterns don't guarantee future outcomes. Do your own research before acting on any levels discussed here.