

Bitcoin Price Prediction: BTC at a Crossroads Near $84,000
Bitcoin is holding steady near a key resistance test after fresh whale buying pushed the price back above a closely watched level.
Bitcoin launched in 2009 as the first decentralized digital currency and remains the largest cryptocurrency by market value.
BTC trades at $84,394.23, up 0.7% over the past 24 hours. This Bitcoin price prediction reviews whether the current setup supports a move toward higher resistance.
Market capitalization stands at $1.696 trillion, with a circulating supply of 20.089 million BTC against a maximum supply of 21 million.
Live Market Data
Source: market data taken from CoinGecko, as of Sep 25, 2026. Figures may vary slightly across other tracking websites.
A widely followed whale-tracking account flagged that BTC reclaimed the $84,000 level within the past day, a move some traders read as an early bullish signal after recent weakness.
Bitcoin News Today
A widely followed whale-tracking account flagged that the asset reclaimed the $84,000 level within the past day, calling it an early bullish signal.

Source: Data Taken From @WhaleInsider, X Account, as of Sep 24, 2026
The reclaim came just as price approached the falling line on the hourly chart, adding some weight to the setup, though a single level rarely confirms a full reversal on its own.
Technical Analysis
Bitcoin's hourly chart shows the price sitting below a falling trendline that has capped gains since the recent local high.
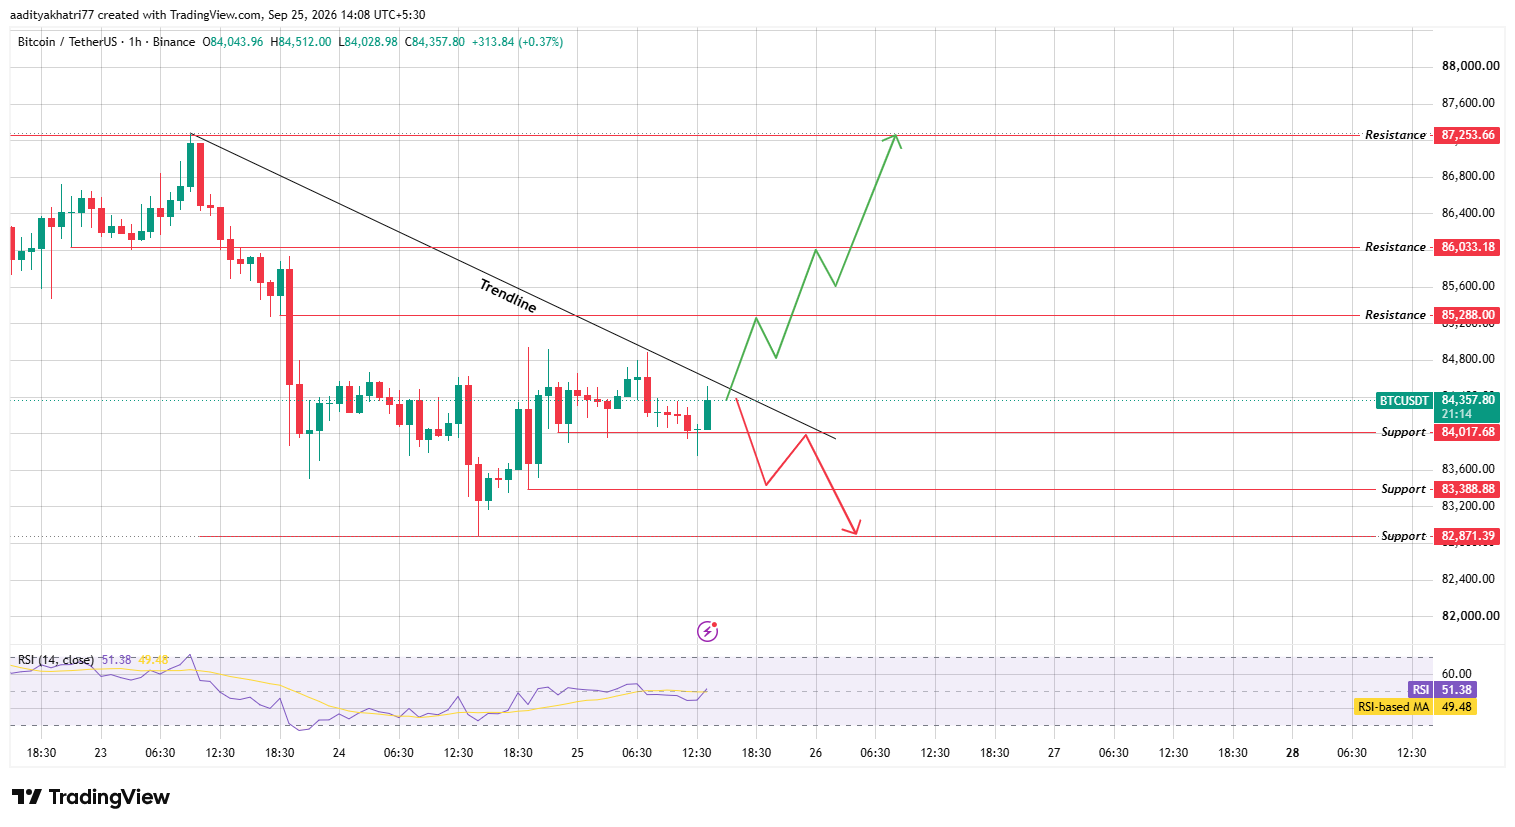
Source: Chart taken from TradingView, as of Sep 25, 2026
RSI reads 51.38, just above its moving average of 49.48, pointing to a cautiously improving tone.
Can BTC Clear Resistance After a Trendline Break?
A break above the trendline on strong volume could push the price toward $85,288. Clearing this level opens a path to $86,033, and a stronger move may extend toward $87,253 if buying continues.
What Happens If Price Gets Rejected at the Trendline?
A rejection from the trendline, followed by a break of support near $84,017, would open a path toward $83,388 and then $82,871 if selling accelerates.
Support and Resistance
Expert Opinion
Analysts tracking this setup note that a trendline break with strong volume tends to carry more weight than one without it, especially after a sharp pullback like this.
Most agree that confirmation above resistance matters more than the reclaim of $84,000 alone before calling this a genuine reversal.
Disclaimer: This article is for informational purposes only and does not constitute financial advice. Crypto markets are highly volatile. Consult a licensed financial advisor before making investment decisions.





