

Is Bitcoin's latest bounce the real deal, or just another head-fake before sellers take back control?
Buyers are reasserting themselves after a choppy few months, and the Bitcoin price prediction 2026 conversation has quickly shifted from damage control to genuine opportunity.
Traders are split on whether this move is the start of something bigger or just another swing inside a wider range.
Momentum is building, positioning is leaning long, and the next few weeks could settle the question either way.
BTC Price Today: Where Does Bitcoin Stand Right Now?
Bitcoin is changing hands near $83,976, up roughly 0.29% on the day, according to Coinglass data.
The token's market capitalization sits close to $1.68 trillion, with a fully diluted valuation nearly identical to that figure since more than 20.08 million of the 21 million maximum supply is already in circulation.
Combined spot and futures turnover has stayed heavy, with Coinglass showing futures volume around $57.29 billion against roughly $4.18 billion in spot activity over the past 24 hours.
How Has Bitcoin Performed Across Timeframes?
Short-term price action shows a token still working through recovery. Bitcoin is up close to 3.79% over the past week and 6.24% over the month, while the 90-day gain sits near 40.08%, though it's still down about 4.05% year to date and 23% over the past year.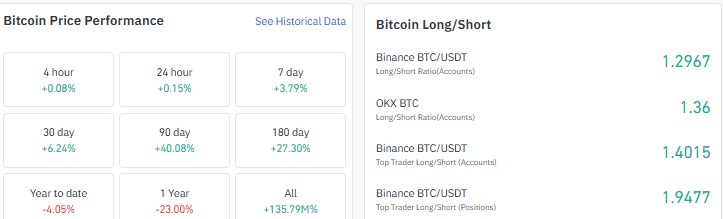
Positioning across major venues is tilted long, with Binance and OKX long-short ratios near 1.30 and 1.36, and Binance's top-trader accounts even more skewed toward longs.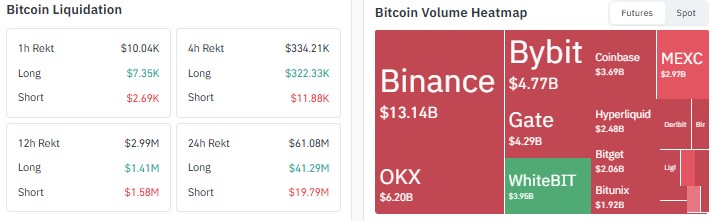
That leverage cuts both ways. Coinglass data shows roughly $61.08 million in liquidations over the past 24 hours, split unevenly toward longs, and one trader reportedly opened an $88 million leveraged long position.
That sat just $1,000 away from liquidation, a reminder of how stretched some positioning has become.
How Is Bitcoin's DeFi Activity Trending?
Away from spot and futures markets, Bitcoin's footprint in decentralized finance has cooled a little.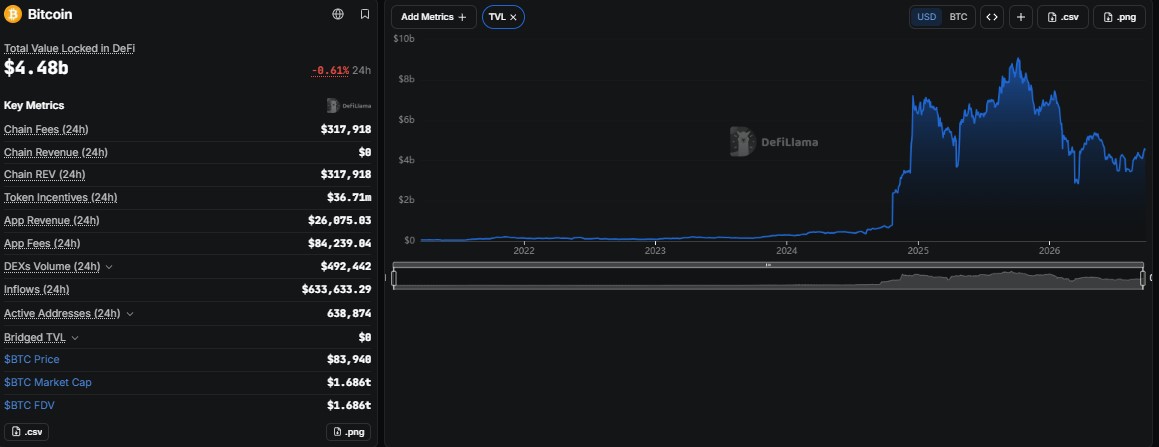
Total value locked tied to the network sits near $4.48 billion, down about 8.61% over the past 24 hours per DefiLlama data.
Daily chain fees near $317,918 and active addresses above 638,000 suggest usage hasn't dried up, even as locked value pulls back from recent highs.
What News Is Driving Bitcoin Right Now?
The bigger catalyst this week is regulatory rather than on-chain. After the CLARITY Act failed to pass, the SEC has reportedly begun offering informal clarity of its own. 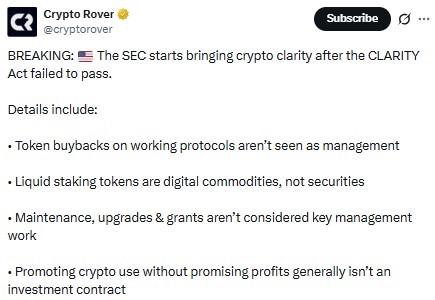
Indicating that things like token buybacks on working protocols, maintenance and upgrades, and promoting adoption without promising profits generally fall outside securities treatment, while liquid staking tokens are being viewed as digital commodities.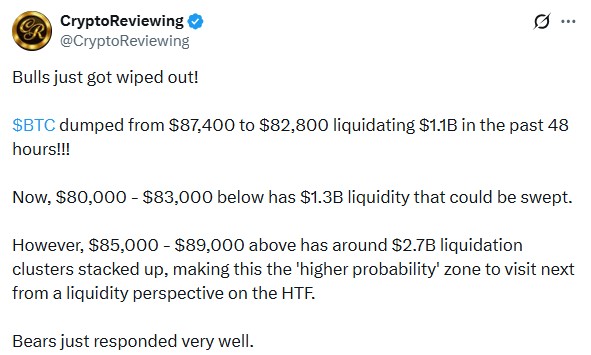
Separately, derivatives analysis flagged a heavy liquidity cluster sitting between $85,000 and $89,000, suggesting that zone, rather than the $80,000 to $83,000 area below, may be the more probable one to be tested next.
Bitcoin Weekly Chart: Bitcoin Price Prediction 2026
The TradingView weekly chart tells a story of a token that keeps rotating between sharp breakouts and long stretches of consolidation.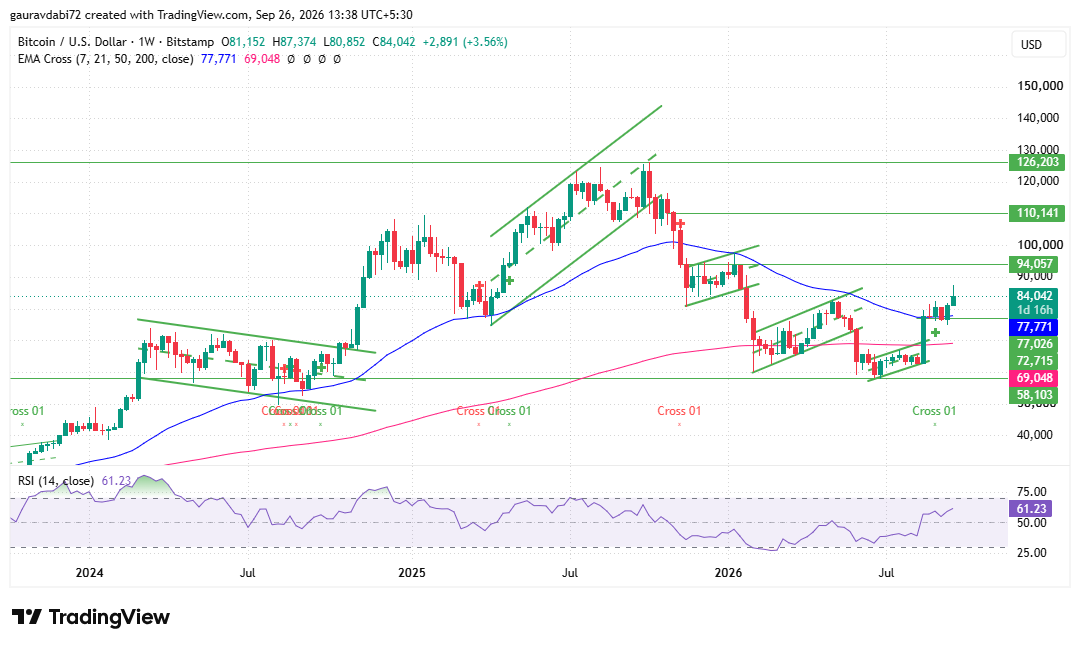
A descending channel gave way to a breakout that carried price into a 2025 ascending channel toward the $126,203 region, before a breakdown dragged it into a multi-month consolidation range.
Another breakdown followed in February, pulling the token back toward the $60,000 to $80,000 band, where it has spent most of this year building structure.
That base now looks to be resolving higher again, with the price closing the latest week near $84,042, up 3.56%, and firmly back above the most recent descending structure.
The 7-period EMA near $77,771 has moved back above the 50 and 200-period cluster around $69,048, a setup that typically favors continuation if buyers keep showing up.
RSI near 61 leaves room to run before anything looks stretched. Resistance sits at $94,057, then $110,141, with the prior cycle high near $126,203, well above the current price; support looks to hold in the $77,000 to $80,852 zone where the EMA cluster and last week's low line up.
What Could Bitcoin Price Do Next?
What Are the Key Risks to Watch?
Leverage remains the biggest wildcard. With long-short ratios skewed heavily toward longs and a large liquidation cluster stacked between $85,000 and $89,000, a fast move higher could just as easily trigger a sharp reversal once that liquidity is swept.
Regulatory clarity is improving but remains informal rather than codified in law, leaving room for policy risk to resurface.
A continued slide in DeFi-linked value locked would also be worth watching as a sign of softer on-chain demand.
Expert Opinion: What Does the Analyst Desk Think?
As per the analyst desk, the combination of a weekly close back above the prior breakdown structure, a bullish EMA crossover, and RSI still short of overbought territory points to constructive, if leverage-dependent, momentum.
The stacked liquidation zone just above the current price is likely to be tested before any sustained move toward six-figure gains of conviction.
Conclusion
Bitcoin Price Prediction 2026 weekly structure has flipped constructive again, backed by improving regulatory signals and long-skewed but risk-heavy positioning.
Whether the token can extend toward $100,000 in 2026 will likely hinge on how it handles the liquidity sitting just overhead.
Disclaimer: This article is for informational purposes only and should not be treated as financial or investment advice. Cryptocurrency markets are highly volatile, and readers should conduct their own research before making any investment decisions.





