XRP Price Prediction: Can the Flip Zone Send XRP to $1.4957?
The token is currently trading right at a flip zone on the hourly chart, and this kind of level tends to decide direction once the price actually commits to one side.
Here is what the data, a fresh whale buying report, and the chart are showing right now.
Price Today: Live Data and 24-Hour Change
The current price sits around $1.2961, up a modest 0.61% on the day, a gain of about $0.007858.
Market cap is holding at $81.48 billion, open interest stands at $2.75 billion, and trading activity remains heavy, with 24-hour futures volume at $4.69 billion against $1.04 billion in spot volume.
Circulating supply is 62.87 billion tokens, out of a total supply of 99.98 billion and a max supply capped at 100.00 billion.
Source: CoinGlass, data snapshot, September 17, 2026.
Latest News: Franklin ETF Clients Add More XRP
According to a post from Whale Insider on X, Franklin ETF clients bought $3.5 million worth of XRP, a fresh data point on institutional demand for the token.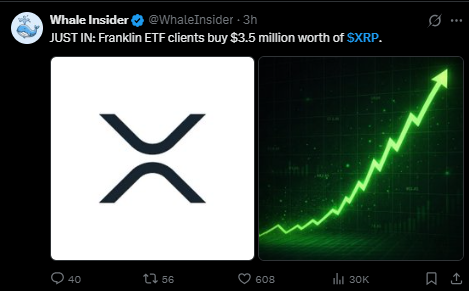
This kind of ETF-linked buying tends to get read as a sign of steady accumulation rather than speculative trading, since it typically reflects longer-term positioning rather than a quick in-and-out trade.
Source: Whale Insider on X, September 17, 2026.
Quick Take
CMP: $1.2971 on the 1-hour Binance perpetual chart
Bullish trigger: close above the $1.3026 to $1.3096 flip zone, targeting $1.4957
Bearish trigger: close below $1.2471, targeting $1.2012
Data as of: September 17, 2026, 16:51 UTC+5:30
Risk note: a wick through either boundary means less than an actual closing confirmation.
Technical Forecast: Reading the Flip Zone
Chart source: TradingView, 1-hour timeframe, Binance, September 17, 2026, 16:51 UTC+5:30. 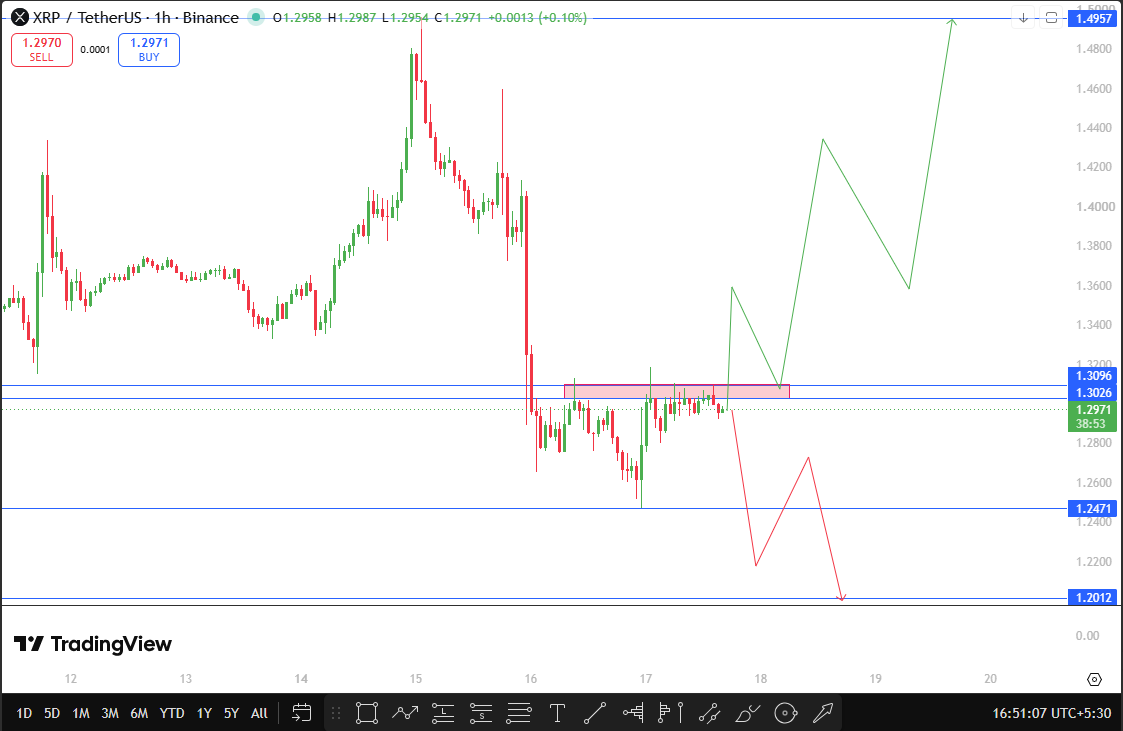
Price is currently trading right at a range between $1.3026 and $1.3096, a level that has already switched roles between support and resistance recently and is now being tested again. zones like this tend to act as a genuine decision point, since the market has already shown it respects this exact range.
A close above $1.3096, the top of this range, would be the first sign buyers are taking control, opening the path toward $1.4957, roughly 15.3% above the current price.
On the downside, a close below $1.2471, around 3.9% under current levels, would confirm the range failing to hold as support, putting $1.2012 in view next, about 7.4% below CMP.
Support and Resistance Levels
Bull, Base, and Bear Scenarios
In the bull case, a confirmed close above the $1.3026 to $1.3096 flip zone flips this setup bullish, opening a path toward $1.4957, with growing ETF-linked demand adding some support to that thesis.
The base case has price continuing to chop right around this flip zone a bit longer, unable to commit cleanly to either side.
In the bear case, a close below $1.2471 confirms the flip zone failing as support, with $1.2012 as the next stop.
Risks to This Outlook
Flip zones can produce false breaks in either direction before the real move actually confirms, so a wick alone should not be treated as a signal.
The Franklin ETF buying is a real, reported data point, but a single $3.5 million purchase is small relative to XRP's overall market cap and trading volume, so its price impact should not be overstated.
Broader crypto sentiment, particularly sudden Bitcoin moves, can override this setup regardless of how the flip zone resolves.
Glossary
Flip zone: a price area that has switched roles between support and resistance, now acting as the opposite of what it once was.
Pattern trigger: the price level whose closing break confirms which direction a chart pattern is resolving.
Open interest: the total number of outstanding derivative contracts that have not yet been settled.
Disclaimer
This article is for informational purposes only and should not be considered financial advice. Price prediction figures and technical analysis shared here are based on chart patterns and publicly available data at the time of writing. Cryptocurrency markets are highly volatile, and prices can move sharply in either direction without warning. Always do your own research and consult a qualified financial advisor before making any investment decisions.