
A token jumping from cents to sixty cents in days grabs attention fast. Bedrock (BR) did exactly that. This Bedrock Price Prediction breaks down the chart, the unlock schedule, and whale wallets, and it sits alongside the earlier bitcoin price prediction coverage for context on where majors stand.
BR Current Price, Market Cap, and Trading Volume
BR trades near $0.6218 as of September 17, 2026 (14:00 UTC), per CoinMarketCap data.
The 24-hour move sits near 181%, one of the largest single-day gains across the top 250 tokens.
Market cap stands near $187.58M against an unlocked market cap of $329.15M. That gap matters.
Circulating supply reads 301.66M BR out of a 1B max supply, with roughly 88,500 holders. Volume hit $43.17M in 24 hours. Liquidity against market cap sits thin, at 1.68%.
BR Technical Analysis
The daily chart on TradingView shows an ascending channel breakout after weeks pinned under $0.20.
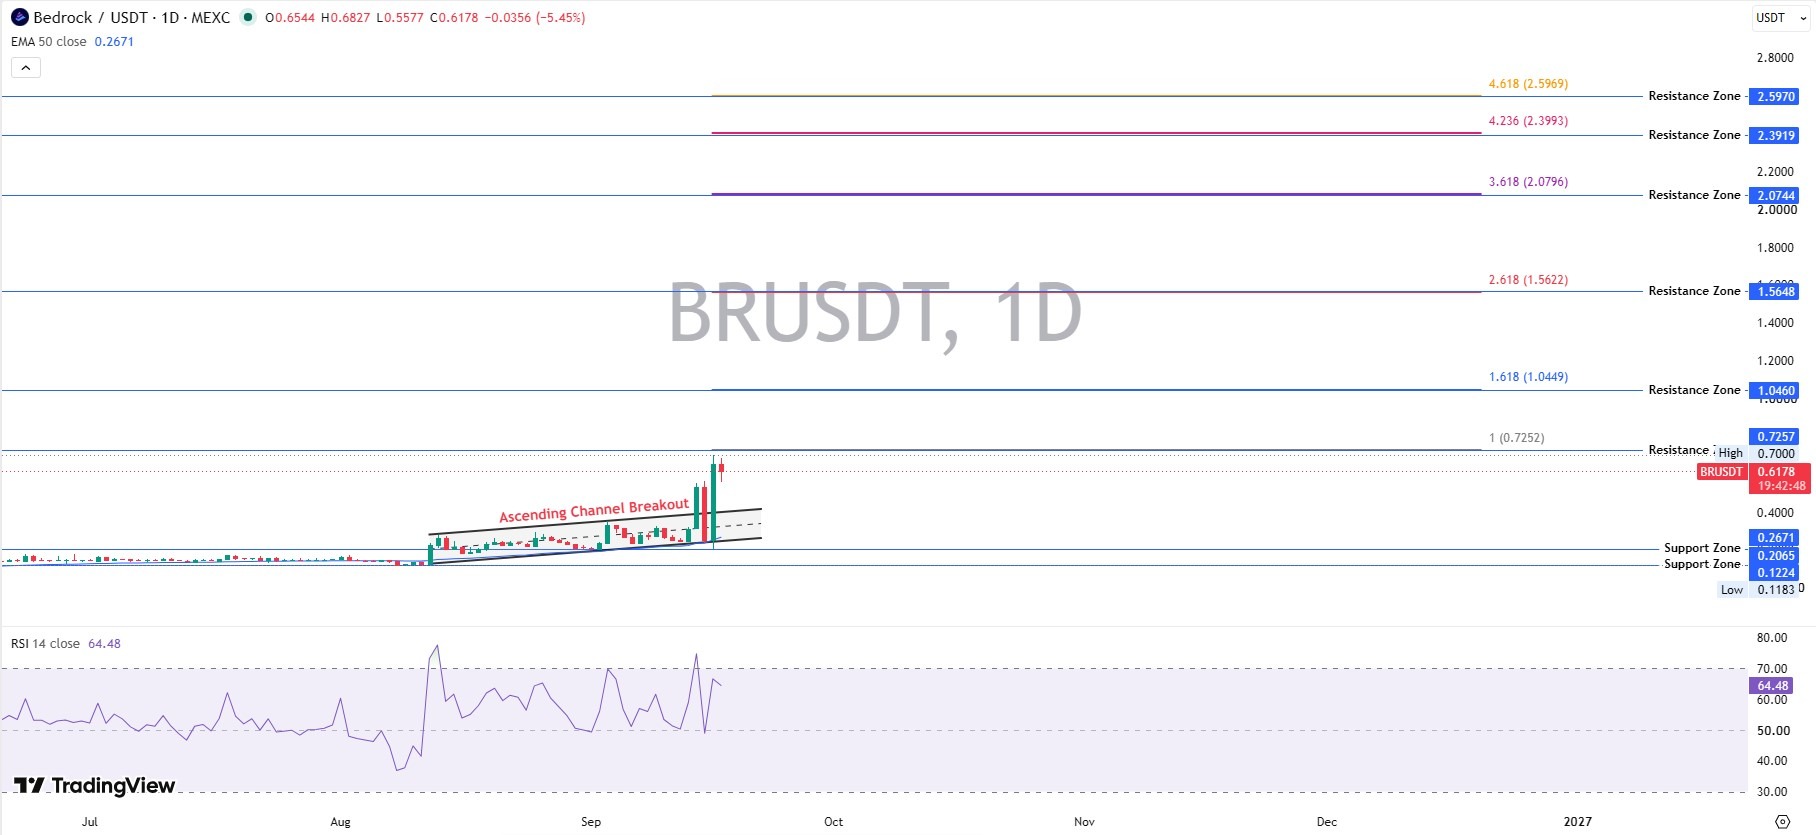
Trading printed a high of $0.6827 before slipping to $0.6180, a pullback of 5.42%. Price sits well above its 50-period EMA of $0.2671.
Steep. Fast. Not unusual after a breakout like this.
BR RSI and MACD
Momentum reads odd. The 14-period RSI sits at 64.48, elevated but not overbought above 70.
MACD looks more decisive. The MACD line sits at 0.0738, above the signal at 0.0402, with the histogram at 0.0336 and still expanding.
When we pulled up the RSI, the first thing that stood out was how far price ran without tripping overbought signals. Room to run, or a lagging gauge catching up late?
BR Volume Analysis
Volume expanded alongside the breakout candle. And that strengthens the case for a real structural shift, not a thin wick.
A breakout on weak turnover fades fast. This one didn't.
Key Support Levels
Immediate support sits at $0.2065. Major support follows at $0.1224, with the deeper structural low at $0.1183.
Key Resistance Levels
Immediate resistance sits at $0.7257. Fibonacci extensions mark $1.0460, $1.5648, and $2.0744 as the next shelves higher.
Breakout Confirmation Level
A sustained trade above $0.7257, with rising volume, would confirm continuation toward $1.0460. Anything less looks like another wick.
Bearish Invalidation Level
A full session below $0.2065, followed by a failed reclaim, breaks the bullish structure. Losing $0.1183 after that undoes the entire September thesis.
Bull, Base, and Bear Case
Bull case: reclaim $0.7257 with expanding volume, targets at $1.0460, $1.5648, and $2.0744, conditional on an orderly unlock.
Base case: consolidation between roughly $0.35 and $0.70 while the market digests the move.
Bear case: a breakdown below $0.2065 opens the path to $0.1224, then $0.1183.
Bedrock Price Prediction Scenario Table
What Could Drive Bedrock Price Higher?
Ecosystem activity looks real. Bedrock's Optimism Splash Phase 2 campaign, running September 10 to 24, 2026, targets a $1M TVL milestone on Velodrome, per the project's own official announcement.
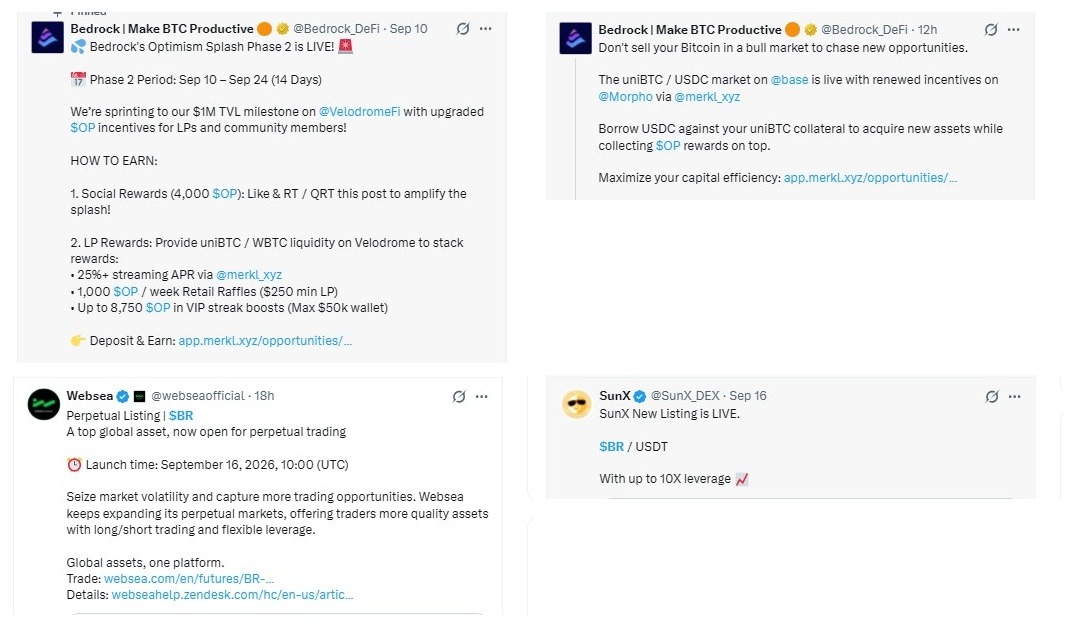
New perpetual listings on Websea, live from 10:00 UTC on September 16, 2026, and on SunX with up to 10X leverage, add derivative volume. That cuts both ways, since leverage magnifies moves in either direction. Explore related crypto exchange listings for how this compares across other tokens this week.
Bedrock Token Unlock and Supply Risk
Initial circulating supply at token generation was 210M BR, or 21% of max supply, per Bedrock's tokenomics documentation. Close to 92M tokens have entered circulation since.
Vesting runs across five tracks: Founding Team, Seed Investment, Community Airdrops, Marketing and Partnership, and Strategic Reserve.
A widely flagged unlock lands near September 20, 2026. The exact count isn't detailed in the document reviewed here. Confirm the figure through a live unlock tracker before trading around it.
Bedrock Whale Activity and On-Chain Data
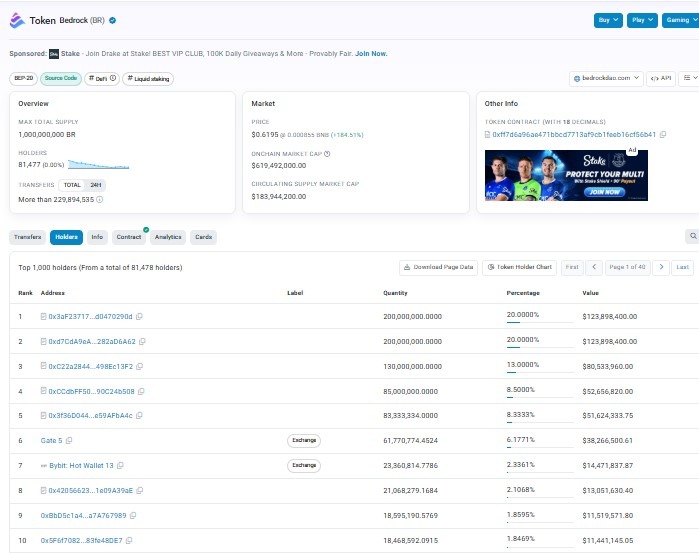
Holder data on BscScan shows heavy concentration. The top five wallets alone hold close to 70% combined.
Exchange wallets from Gate and Bybit sit inside the top ten. Total holder count sits near 81,500 on-chain, modest for this market cap.
A handful of wallets can move prices fast. Timing matters here.
Bedrock Price Prediction vs. Other Forecast Models
Published BR numbers vary widely across sites because the method differs. Some trackers run pure historical volatility; others use user-input growth rates. This breakdown weighs live chart structure against unlock and whale data instead.
Risks to the Bedrock Price Prediction
Token unlocks, whale concentration, and thin liquidity all rank high. Add leverage-driven volatility from new listings, and the risk list gets crowded fast. Readers comparing early-stage projects can browse the crypto presale listings or the ICO announcements hub for pipeline context.
Trader Takeaway
Bullish confirmation: BR reclaims $0.7257 with rising volume.
Neutral: price stays boxed between $0.2065 and $0.7257.
Bearish confirmation: BR loses $0.2065 and fails to reclaim it.
Invalidation comes below $0.1183, full stop.
Disclaimer
This article is for informational purposes only and does not constitute financial, investment, or trading advice. Cryptocurrency prices are highly volatile, and past performance does not guarantee future results. Independent research and consultation with a licensed financial advisor are strongly recommended before making investment decisions.