

XRP Price Prediction: XRP Eyes $2.0323 After ETF Inflows
XRP price prediction chatter is picking up pace this week, and the timing lines up with a genuinely strong technical setup.
The asset is holding inside a rising channel while fresh ETF inflow data adds real weight behind the move. Traders now have two clear levels to watch before the next big decision plays out.
Ripple Price Today
The token is trading at $1.5561, up a solid 6.36% over the last 24 hours according to CoinGlass. Market cap sits at $97.88B, backed by $6.10B in futures volume and $1.18B in spot volume over the same window.
Open interest is holding at $3.74B, and 62.87B of the 100.00B max supply is already in circulation, leaving a meaningful chunk still to enter the market over time.
A move of this size on strong volume usually signals more than casual buying, and the setup below helps explain why.
Source: CoinGlass, September 25, 2026
XRP Latest News
BSCN (@BSCNews) posted on X that spot ETFs tied to Ripple's flagship asset are having a genuinely standout week. 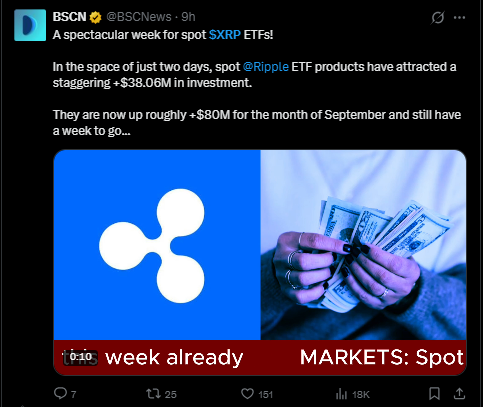
In just two days, the products pulled in $38.06M of fresh investment, and the group is now up roughly $80M for September with a full week still left on the calendar.
Inflows building this fast, this late in the month, suggest institutional appetite is accelerating rather than tapering off, and that kind of demand often lines up neatly with the technical picture playing out on the chart.
Source: BSCN (@BSCNews) on X, September 25, 2026
Quick Take
Current Market Price: 1.5565 (1h Binance chart)
Upside Trigger: Close above 1.6585, roughly 6.55% above CMP
Downside Trigger: Close below 1.4535, roughly 6.62% below CMP
Data Timestamp: September 25, 2026, 15:07 IST
Risk Note: This resistance zone has capped price more than once already, so it's worth waiting for a confirmed hourly close rather than reacting to an intrahour wick.
XRP Price 2026 Technical Forecast
Price has been trading inside a well-formed ascending channel since climbing off its recent low near 1.50, respecting both the upper and lower boundary lines closely along the way. 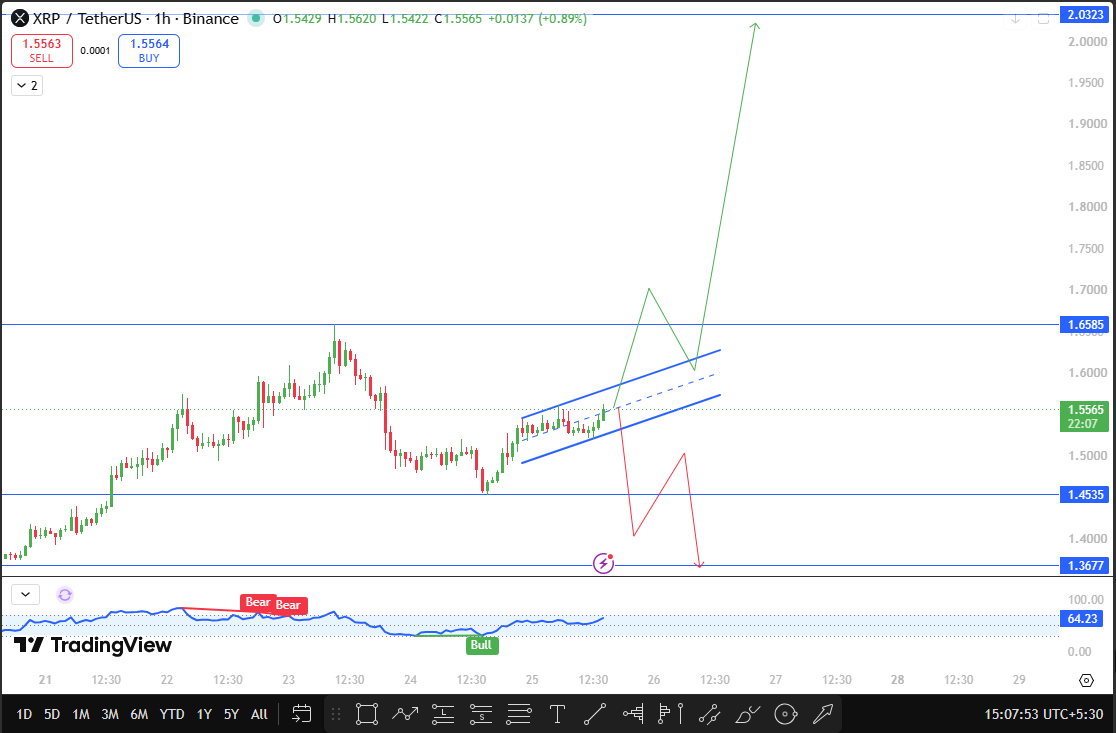
The 1h RSI reads 64.23, comfortably bullish after flipping from two bearish readings earlier in the week, and that shift lines up neatly with the steady climb higher.
A confirmed hourly close above 1.6585 would mark a genuine breakout rather than just another test of the boundary, opening the door toward a much larger move up to 2.0323.
If the channel fails instead and the close comes in below 1.4535, the setup flips, and 1.3677 becomes the next level buyers would need to step in and defend.
Chart source: TradingView, Binance perpetual contract, 1h timeframe, September 25, 2026, 15:07 IST
Support and Resistance Levels
Bull, Base, and Bear Scenarios
The bullish path is fairly clean here: a close above 1.6585 confirms the breakout and puts 2.0323 on the map.
That kind of move would line up well with the ETF inflow momentum already building, and fresh institutional money chasing a breaking chart has a habit of feeding on itself for a while once it gets going.
The quieter, more likely near-term outcome has price simply continuing to ride the channel, bouncing between 1.4535 and 1.6585 while inflows keep accumulating in the background without forcing an immediate resolution either way.
If sellers show up instead and the close lands below 1.4535, that breaks the channel structure entirely and shifts attention down toward 1.3677.
A failed bounce that can't reclaim 1.4535 within a candle or two would be the clearest early sign that buyers have lost this particular round.
Risks to Watch
ETF inflows have been a strong tailwind lately, but any slowdown in that pace could pull steam out of the current move fairly quickly.
Broader market direction, especially Bitcoin's own price action, still tends to override individual altcoin setups on short timeframes like this one, so the channel story here isn't happening in isolation.
A rejection right at 1.6585 after this much buildup wouldn't be surprising either, given how often that exact zone has acted as resistance in recent sessions.
Glossary
- Ascending Channel: A price structure formed by two parallel upward-sloping trendlines marking support and resistance.
RSI: Relative Strength Index, a momentum gauge running from 0 to 100.
Open Interest: The total value of outstanding futures contracts yet to be settled.
Disclaimer
This article is for informational purposes only and does not constitute financial advice. Cryptocurrency markets are volatile, and you should do your own research before making any trading or investment decision.





