

This UChain Price Prediction tracks a 75.01% surge and an RSI of 85.92, using data from September 19, 2026, 07:00 UTC.
Price sits near $332. Risk is high. The latest crypto price predictions show how quickly setups change.
The breakout is real, but thin volume makes a pullback the base case.
UChain Price Prediction 2026: Quick Outlook
Snapshot time: September 19, 2026, 07:00 UTC.
UChain Price Today and Market Data
Price, Market Cap and Volume
CoinMarketCap data shows the UCN price at $332.31 with a $16.61M market cap, which is price times circulating supply.
Volume, though? Just $196.83K traded in 24 hours. Thin.
Supply and FDV
Circulating supply is 50,000 UCN, while total and maximum supply are both 100,000. Fully diluted valuation (FDV), which prices every token as circulating, is $33.23M.
Some trackers list 100,000 circulating, so this guide sticks to one source.
Where UCN Is Trading
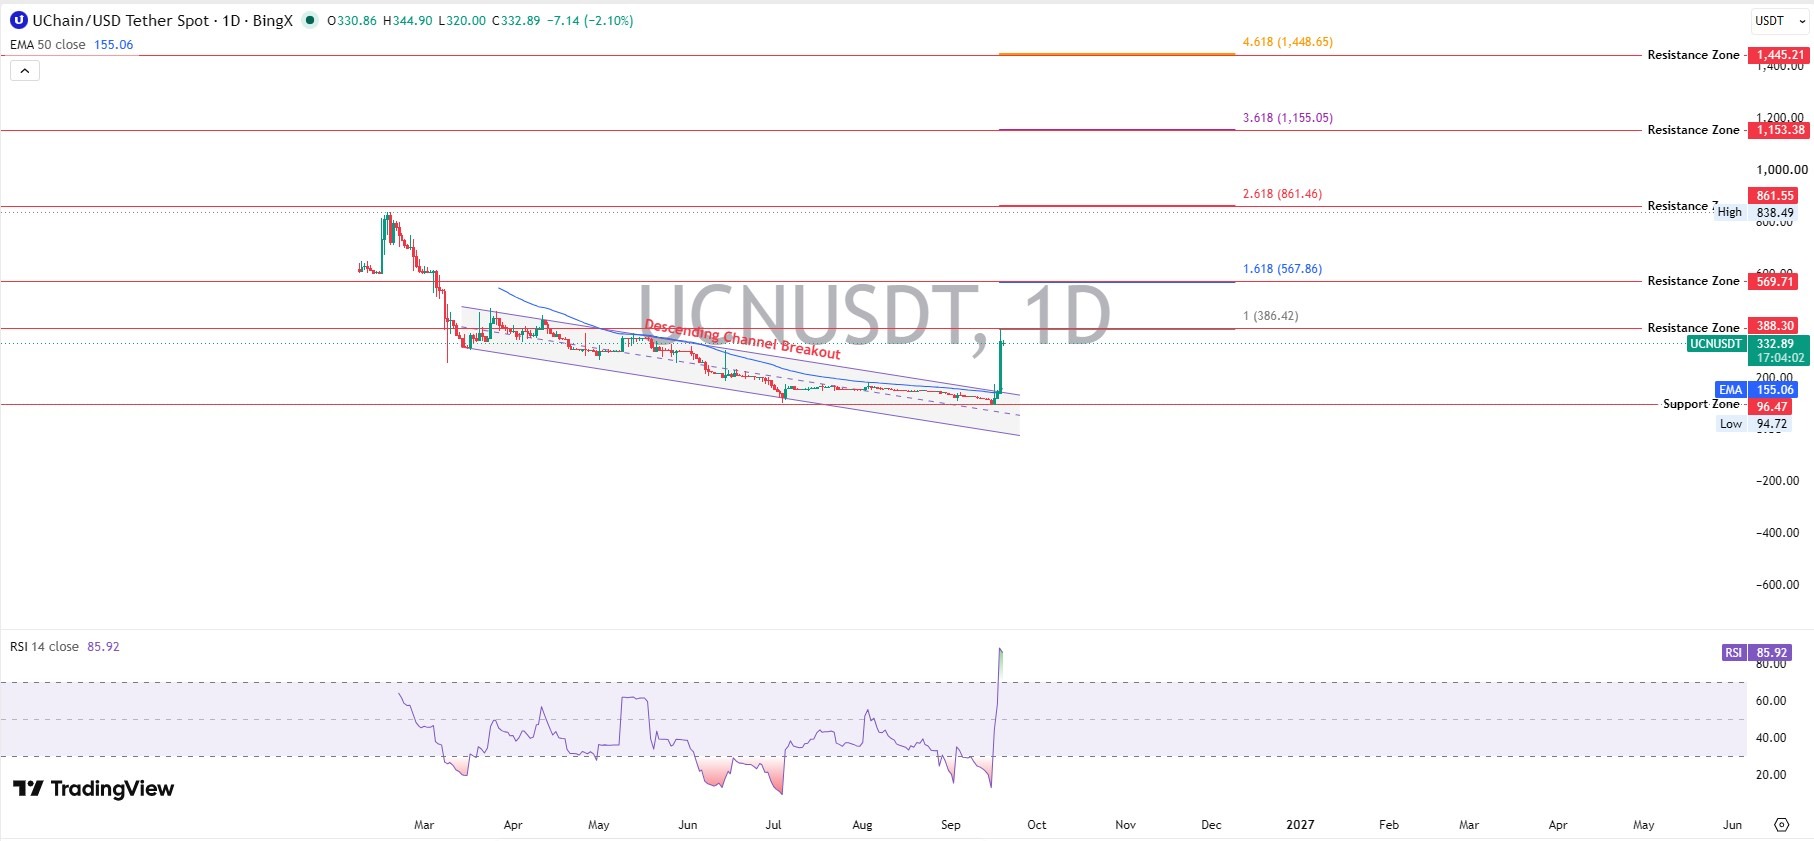
The chart tracks UCN/USDT on BingX. Today's range runs $320.00 to $344.90, and the 24-hour range stretches from $189.86 to $347.34.
But the daily candle reads -2.10%. The pop has already cooled.
UChain Technical Analysis
Trend
Price broke out of a descending channel, two falling trendlines that guided months of lower highs. Turns out, TradingView charts confirm the escape.
Bullish trend. Actually, bullish structure, bearish timing.
RSI
The Relative Strength Index (RSI) scores momentum from 0 to 100, and above 70 means overbought. When we checked UCN RSI, the 14-period reading was 85.92.
That's stretched.
MACD
MACD, short for Moving Average Convergence Divergence, compares two averages to gauge momentum. The UCN MACD reads 24.84 against a 1.87 signal line.
Bullish, but fresh.
Moving Averages
The 50-day exponential moving average (EMA), which weights recent trades heavily, sits at $155.06. Price trades above twice that level.
Extended.
Trading Volume
Volume can't confirm the move yet. And without volume, breakouts fade.
Support and Resistance Levels
Support is a floor where buyers step in. Resistance is a ceiling where sellers appear.
Fibonacci extensions, ratios used to project targets, land near $386.42, $567.86, and $861.46. Here's the thing: $388.30 matters most.
Breakout or Breakdown Setup
Bullish Breakout Trigger
A daily candle holding above $388.30 on rising volume opens $569.71. Headlines in AI crypto news can add fuel.
Bearish Breakdown Trigger
Losing $189.86 on heavy volume, plus a failed reclaim, exposes $155.06.
Invalidation Level
Bullish case fails below $155.06. Full structure fails below $96.47.
UChain Price Prediction 2026
The UChain price prediction 2026 assumes the spike digests sideways first. Bear needs thin liquidity to break $189.86.
Bull needs $388.30 to flip into support. Catalysts sit on the coin events calendar.
UChain Price Prediction 2027-2030
These bands rest on market-cap math, not copied algorithms, and assume the full 100,000 supply circulates. The UCN price prediction 2030 bull case needs 15x to 24x today's market cap.
What Could Drive Token Higher?
UChain Ecosystem Adoption
Adoption decides everything. Incentives like crypto airdrops can pull users in.
UWallet, UCard and UTrading Utility
The UWallet app, UCard, and UTrading give token payment and trading uses.
What Could Push Token Lower?
Low Liquidity
At $196.83K in volume, a few sellers could move price.
Failed Breakout
A rejection at $388.30 would trap late buyers.
Bitcoin and Altcoin Market Weakness
Bitcoin trades at $81,328.47 with a $1.63T market cap, and a drop there hits small caps harder. Speculative flows, tracked in memecoin market news, reverse quickly.
Token Whale and On-Chain Analysis
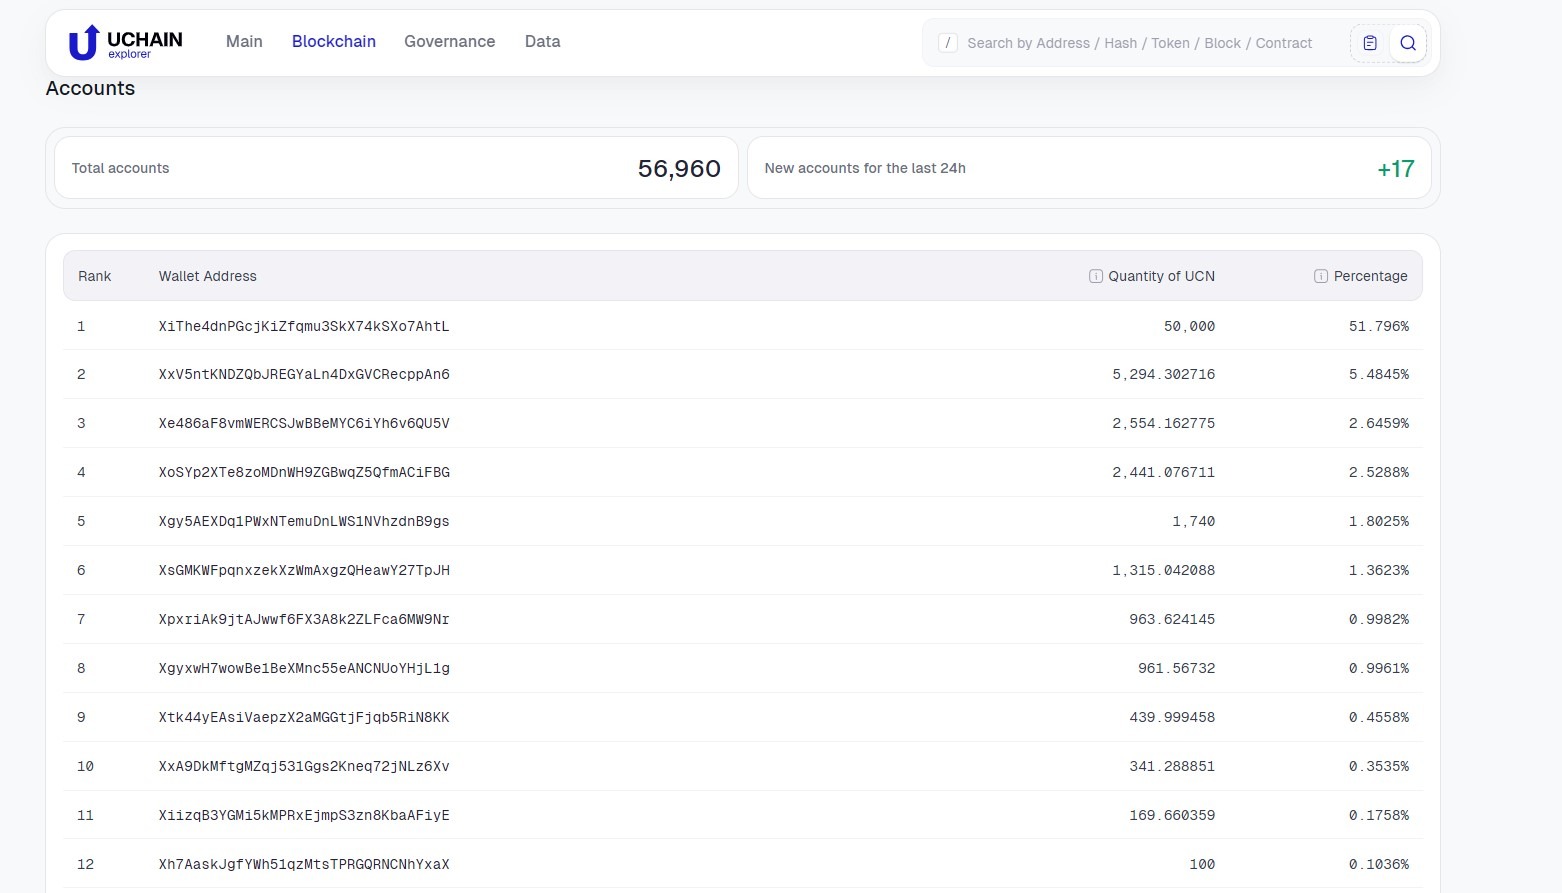
When we opened the UChain explorer, one wallet dominated. It holds 50,000 UCN, or 51.796% of tracked supply.
The top five wallets hold 64.26%, and the top twelve hold 68.70%. Whales control the story.
Transfers made up 91.9% of the 321 transactions in 14 days. And the latest blocks show zero transactions each.
Five of the six latest transfers landed in the fourth-ranked wallet, holding 2,441.08 UCN. It's unlabeled, so exchange balances can't be confirmed.
Only 3,427 UCN is staked, and 17 accounts joined in 24 hours. So who's buying at $332?
UChain Price Prediction: Bull vs Base vs Bear
Bull case: a break above $388.30 with volume targets $569.71, then $861.55. New venues through exchange listing updates would help.
Base case: $190 to $390 while the spike digests.
Bear case: losing $189.86 targets $155.06, then $96.47 if that fails.
Invalidation: trading below $155.06 breaks the bullish thesis.
Can UCN Recover Next?
A full recovery to the $1,806.33 peak from January 10, 2026 needs about 5.4x from here.
The UChain whitepaper promises 2,000 transactions per second and 3-second blocks. But usage data shows 321 transactions in 14 days.
Even the whitepaper warns that prolonged corrections are possible. Recovery is plausible. A full one isn't the base case.
Can UChain Reach $500 or $1,000?
Required Market Cap = Target Price × Circulating Supply.
At 50,000 UCN circulating, $500 needs $25M and $1,000 needs $50M. At 100,000 UCN, those double.
The current market cap is $16.61M. So $500 means +50.5%, and $1,000 means +200.9%.
Bitcoin's $1.63T market cap dwarfs token . And the peak proves $1,000 has traded before.
$500 is plausible. $1,000 needs liquidity first.
Disclaimer
This article is for information only and isn't financial advice. Crypto is volatile, and token is a small-cap token with thin liquidity. Independent research should come before any trade.