
Is Polkadot finally turning the corner after its long slide? $DOT has stopped making new lows and is curling upward, which is why the Polkadot Price Prediction 2028 question is back in focus.
The turn is early and still needs proof. A few weekly levels will decide whether this recovery grows into a real rally or fades.
$DOT Price Today: Market Cap and Supply
Polkadot is trading near $1.1757, down about 3.22% over 24 hours, according to Coinglass. 
The page lists a market cap of $1.99 billion and a circulating supply of 1.70 billion against a 2.10 billion maximum, so roughly 81% of the cap is already in circulation. Spot volume is $31.35 million.
Is Leverage Driving DOT Open Interest?
Futures volume of $219.23 million is about seven times spot volume, and DOT open interest stands at $238.64 million, per Coinglass, or roughly 12% of market cap. 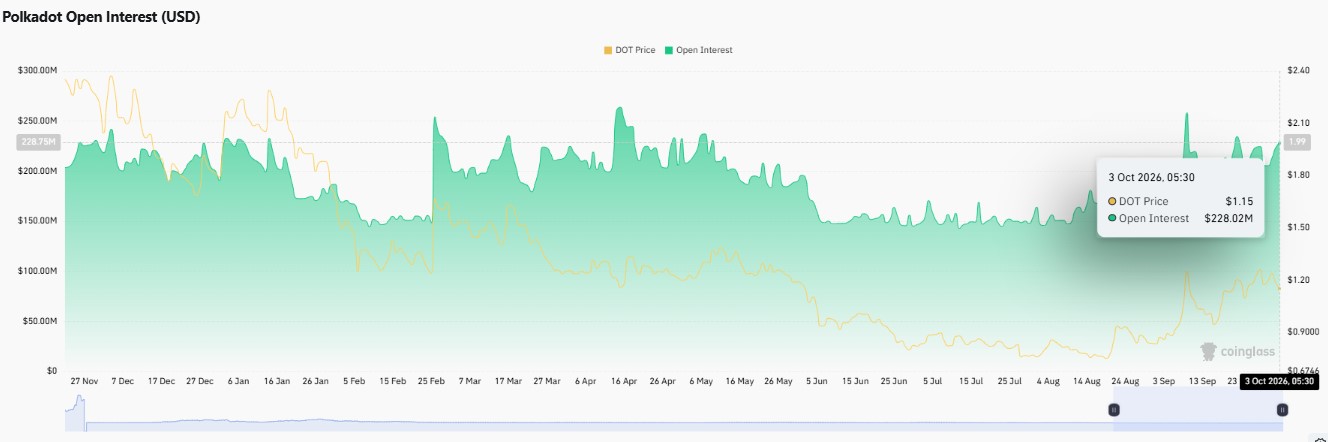
The Coinglass open interest chart shows OI rising through September alongside the price recovery to about $228 million on 3 October.
Derivatives are clearly leading the move.
That can speed a breakout, but it also means a failed push could reverse sharply, so the read is mixed.
Polkadot Network Activity on Subscan
Subscan shows about 33.27 million finalized blocks, 42.38 million signed extrinsics, and 39.66 million transfers recorded on the chain. 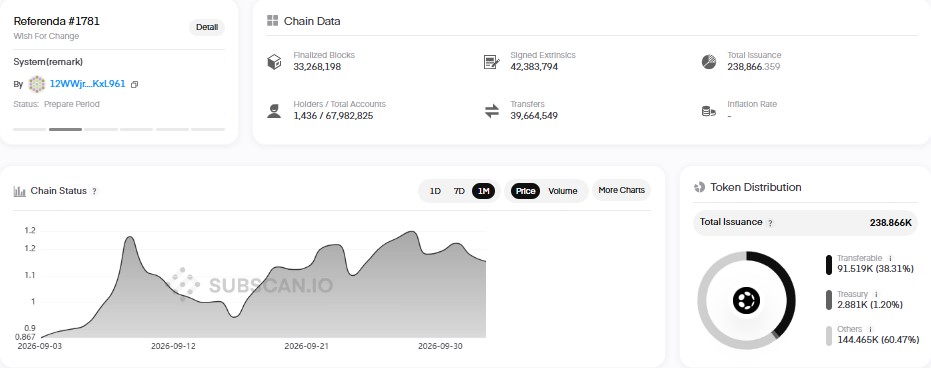
These are cumulative totals, but they point to steady Polkadot network activity over time.
DOT/USD Weekly Chart Analysis: Rounding Bottom From 0.7471
On the DOT/USD chart from TradingView, Polkadot fell sharply before finding support at 0.7471 and curling up into a DOT rounding bottom.
The latest weekly candle closed at 1.1812 after a 6.87% dip, and RSI sits at 50.81, neutral territory.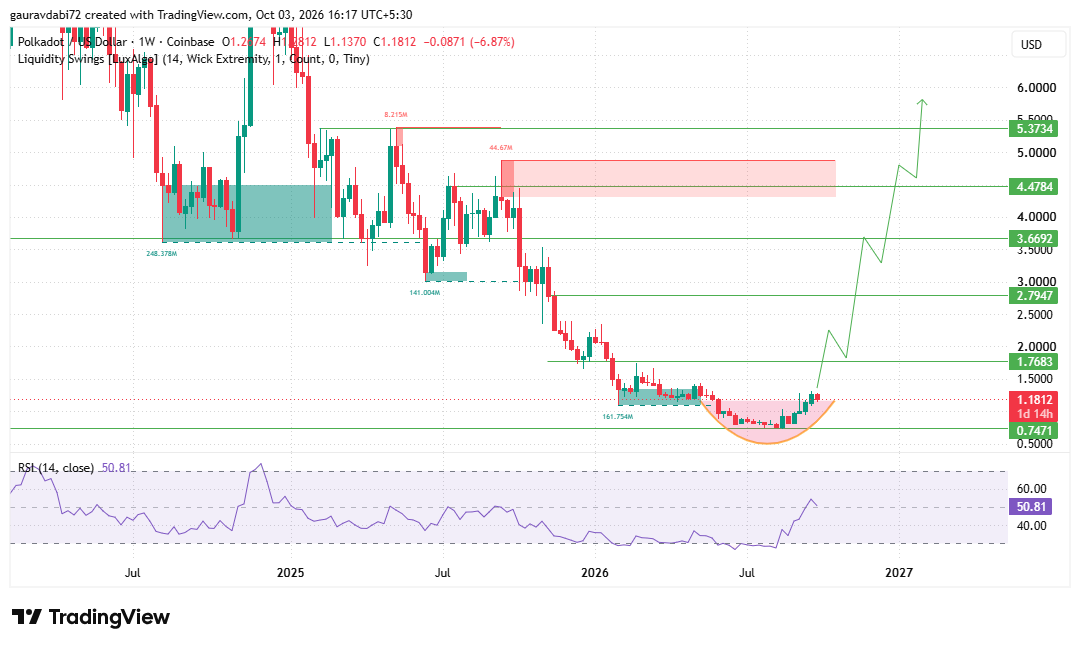
For DOT support and resistance, 0.7471 is the floor that anchors the base. A close below it would break the rounding structure.
On the upside, 1.7683 is the first resistance, about 50% above current levels.
A close above it that holds would confirm the turn and open the way to 2.7947, then 3.6692.
Higher up, 4.4784 sits inside a marked supply zone, and 5.3734 is the top of the mapped range.
How High Can Polkadot Go in 2028? Scenarios From the Weekly Chart
Timing stays conditional. For the Polkadot Price Prediction 2028, the path needs several weekly closes above each zone, and a recovery after 2027 could slip further out if momentum stalls.
Can $DOT Reach $20 in 2028?
A move to $20 would be roughly a 17-fold rise from today's price, while the highest mapped level, 5.3734, is itself about 4.5 times current levels. So $20 sits far beyond every zone on the chart.
It is a headline scenario, not a forecast. The more grounded question is whether DOT can clear 1.7683 first.
Key Risks for DOT Price in 2028
A weekly close under 0.7471 would break the base. Open interest near 12% of market cap raises the odds of sharp reversals.
Neutral RSI shows momentum has not turned decisively, and a market-wide pullback could override the setup.
Expert Opinion on Polkadot Price Outlook
As per the analyst desk, the Polkadot Price Prediction 2028 starts from an improving structure, since the rounding bottom is intact and the price is rebuilding above support.
The edge is still modest, and a weekly close above 1.7683 is the first signal worth respecting. In this DOT price analysis, 0.7471 is the line that protects the thesis.
Conclusion
The Polkadot Price Prediction 2028 depends on a simple sequence. Hold 0.7471, clear 1.7683 on a weekly close, then work through 2.7947 and 3.6692 with real volume.
A slip under support would reset the picture.
The Polkadot crypto prediction stays cautiously constructive for now, and the Polkadot future price will be decided by weekly closes, not headlines.
Disclaimer: This article is for informational purposes only and is not financial advice. Cryptocurrency markets are highly volatile, and price scenarios are conditional, not guaranteed. Always do your own research before making investment decisions.