
Is Polkadot finally leaving its long downtrend behind? After a brutal stretch of lower highs, DOT has pushed out of the structure that capped it for nearly two years, and sentiment is starting to thaw.
That shift puts the Polkadot price prediction 2027 firmly in focus for traders.
The question now is whether this early strength can build into a durable recovery or fade at the first real test.
Polkadot Price Today: Market Data and Recent Performance
DOT trades near $1.2255, down 0.74% on the day, according to Coinglass. Market capitalization is $2.09 billion, with 1.70 billion DOT circulating against a 2.10 billion max supply, so roughly 81% is already in the market.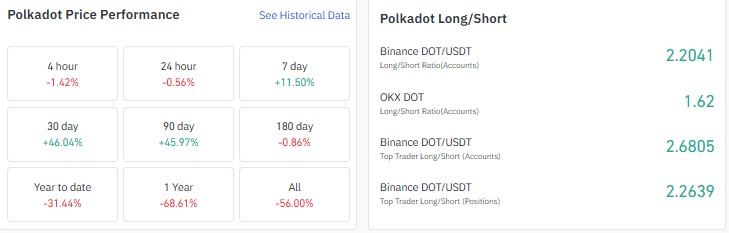
Recent momentum is strong, with gains of 11.50% over seven days, 46.04% over 30 days, and 45.97% over 90 days.
The longer picture remains heavy, with the token down 31.44% year to date and 68.61% over one year.
Polkadot Long-Short Ratio and Liquidations: Are Longs Overcrowded?
Positioning leans long across every venue, per Coinglass. The Binance account ratio reads 2.2041.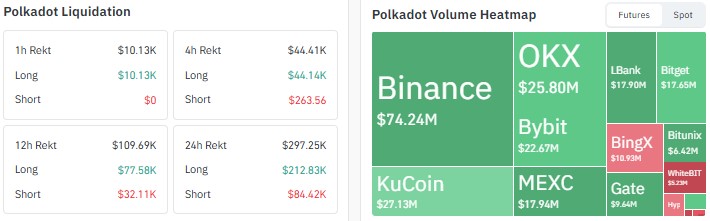
OKX shows 1.62, and Binance top traders sit at 2.6805 by accounts and 2.2639 by positions.
Liquidations confirm the tilt. Of the $297.25K cleared over 24 hours, $212.83K came from longs, and the latest four hours hit longs for $44.14K against just $263.56 in shorts.
Polkadot Open Interest: Is Leverage Fueling the Rebound?
Open interest stands at $219.26 million, per Coinglass. It hovered near $150 million from June to early September, then jumped to roughly $260 million around 9 September as the price broke higher, and has since eased to about $213 million.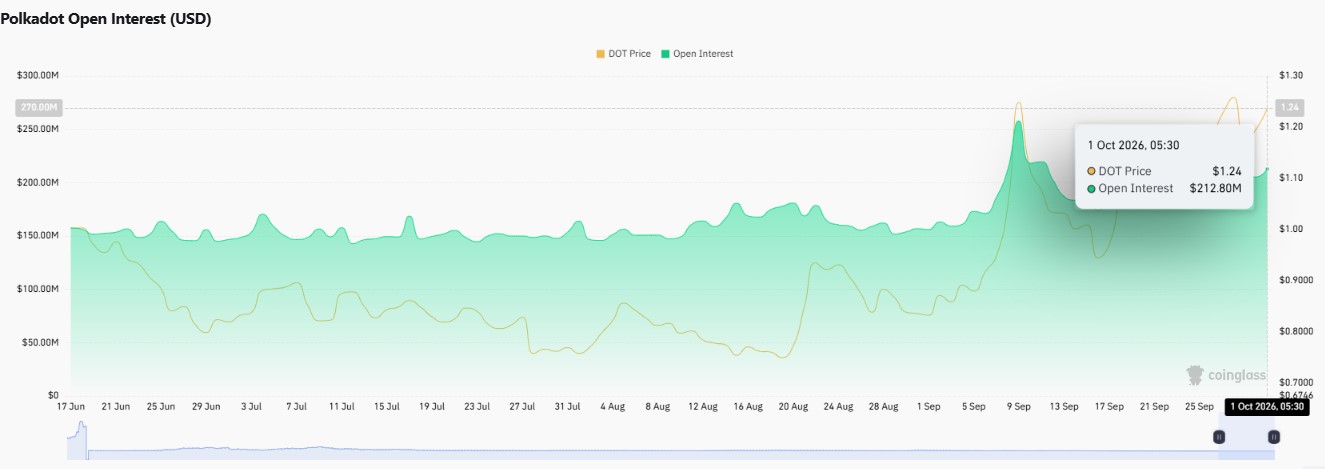
Futures volume of $239.27 million is six times spot volume of $39.77 million. Derivatives clearly lead this move, so spot follow-through matters.
Polkadot News Today:
21Shares announced staking distributions across five crypto ETFs covering Ethereum, Solana, Hyperliquid, Sui, and Polkadot, according to BSCN on X. 
The Polkadot Staking ETF pays $0.045029 per share, with payments scheduled for September 30 and an ex-dividend and record date of September 29.
The payout shows staking rewards flowing directly to fund holders, a quiet sign of institutional interest.
DOT Weekly Chart Analysis:
Per TradingView weekly chart data, DOT spent almost two years sliding inside a falling wedge that began with the late-2024 peak.
In late summer, price finally closed above the upper trendline, and the current pullback, down 3.77% this week, looks like a retest of that line.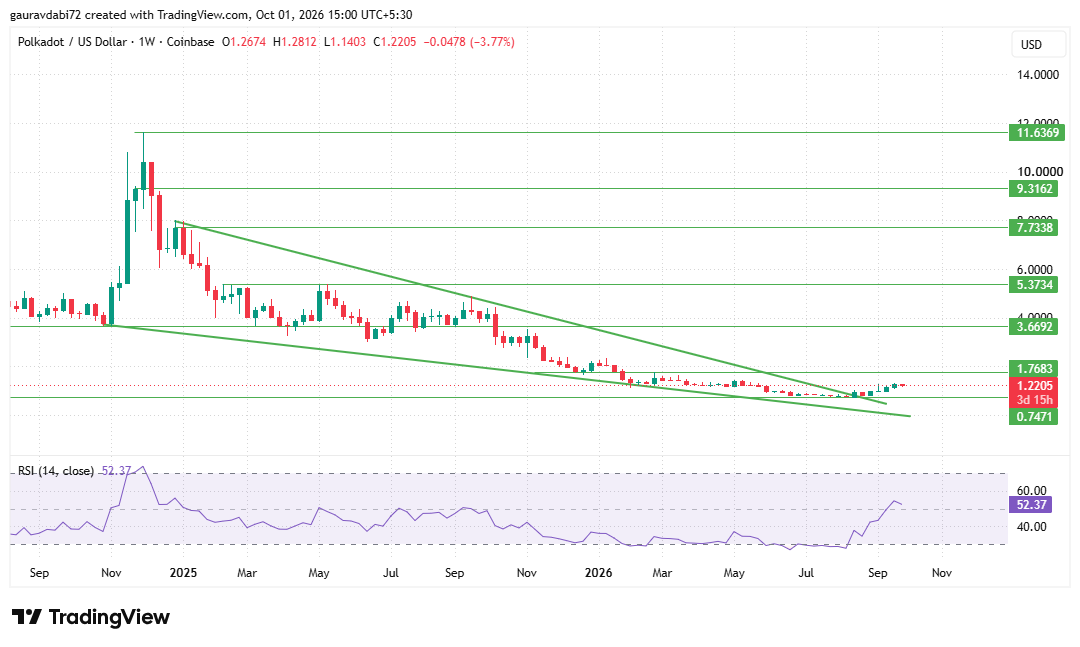
RSI at 52.37 has climbed from depressed readings through most of the downtrend and now sits in neutral territory, which signals recovering momentum rather than strength.
Mapping support and resistance levels is simple. The first hurdle is major resistance at $1.7683, about 44% above the current price.
A weekly close above it, backed by rising volume, would open $3.6692, then $5.3734, $7.7338, $9.3162 and $11.6369.
On the downside, $0.7471 is strong support, roughly 39% lower, and a weekly close beneath it would cancel the breakout.
Polkadot Monthly Outlook: Does the Higher Timeframe Confirm the Breakout?
Per TradingView monthly chart data, DOT has spent close to two years compressing inside a falling wedge that began after the late-2024 spike toward $11.6369.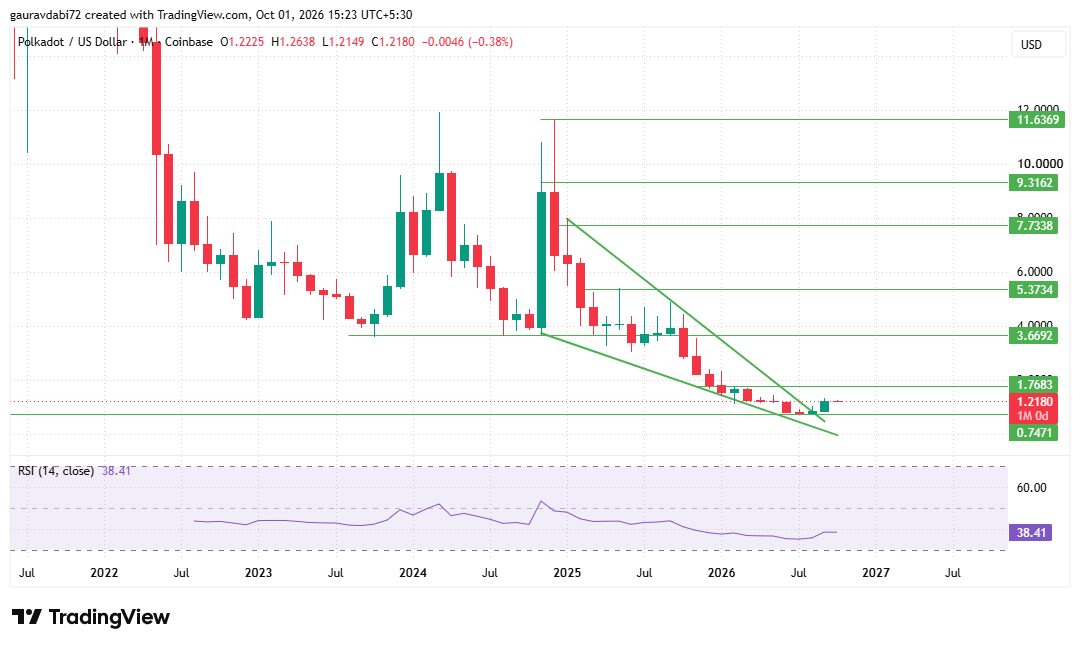
Monthly candles have shrunk steadily since then, price has lifted off the lower boundary, and recent closes have pushed above the upper trendline, the first real structural change in a long while.
RSI at 38.41 still sits below the midpoint, but it has turned up from depressed readings, a profile that fits the early stage of a recovery rather than a finished one.
The levels match the weekly map. A monthly close above $1.7683, more than 40% above the current price, would validate the breakout on the timeframe that matters most and open $3.6692, $5.3734, $7.7338, $9.3162, and $11.6369.
A monthly close back below $0.7471 would cancel the setup.
Polkadot Price Prediction 2027: Base, Bull and Bear Scenarios
This Polkadot price prediction 2027 depends on a clean weekly close above $1.7683, a hold on the retest, and steadier spot volume.
Key Risks for Polkadot in 2027
A weekly close below $0.7471 would turn the breakout into a failed move. Positioning is long-heavy, and derivatives volume is six times spot, so a deeper retest could trigger forced selling.
About 19% of the max supply is yet to circulate, and the token is still down 68.61% over one year. Reaching $11.6369 would imply a market cap near $20 billion.
Expert Opinion: Analyst Desk View on DOT
As per the analyst desk, a breakout after a downtrend this long deserves respect, and the recovery in RSI supports it.
The desk still wants a weekly close above $1.7683 before turning decisively bullish, with $0.7471 as the level that must hold.
Conclusion
Polkadot enters 2027 after a long downtrend with a confirmed wedge breakout, improving momentum and fresh institutional attention.
A weekly close above $1.7683 could open the path toward $3.6692 and beyond, while a loss of $0.7471 would flip the bias lower.
Until then, caution is advised, and the Polkadot price prediction 2027 remains conditional on levels.
Disclaimer: This article is for informational purposes only and is not financial advice. Crypto prices are highly volatile, and all levels and scenarios here are conditional views, not guarantees.