
Has the frog finally hopped out of its cage? After months of squeezing into an ever tighter shape, PEPE has started pushing back, and that is why the Pepe Price Prediction 2028 question is back on trader screens.
The move is early, and the first test is already in sight.
What happens at a handful of weekly levels, and how crowded leverage becomes, will decide whether this turns into a lasting climb or another false start.
PEPE Price Today: Market Cap, FDV and Supply
Pepe is trading near $0.000004236, down about 7.97% over 24 hours, according to Coinglass. 
The page lists a market cap of $1.75 billion and spot volume of $115.95 million.
Per DefiLlama, market cap is $1.781 billion, and fully diluted valuation is the same $1.781 billion, because the full 420.69 trillion supply is already in circulation. 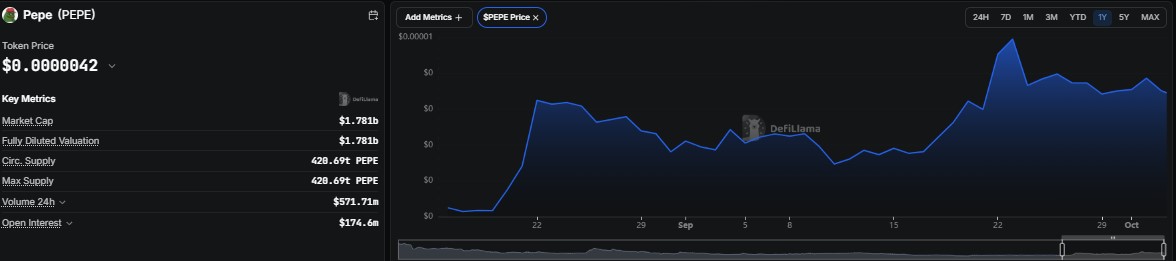
Supply figures differ slightly by source, since Coinglass shows 413.77 trillion, but either way there is no meaningful dilution left to come.
How Heavy Is PEPE Open Interest Against Spot Volume?
Futures volume of $424.31 million is nearly four times the $115.95 million in spot, and open interest sits at $298.99 million, per Coinglass.
DefiLlama lists a lower $174.6 million, so the exact figure varies by source. Even the Coinglass reading equals roughly 17% of market cap, which is a lot of leverage for a memecoin.
That makes PEPE open interest a double-edged signal. It can fuel a fast breakout, but after a near 8% daily drop it also raises the risk of liquidation-driven swings.
PEPE Holder Distribution and Whale Concentration
The Etherscan token page lists 592,783 holders. 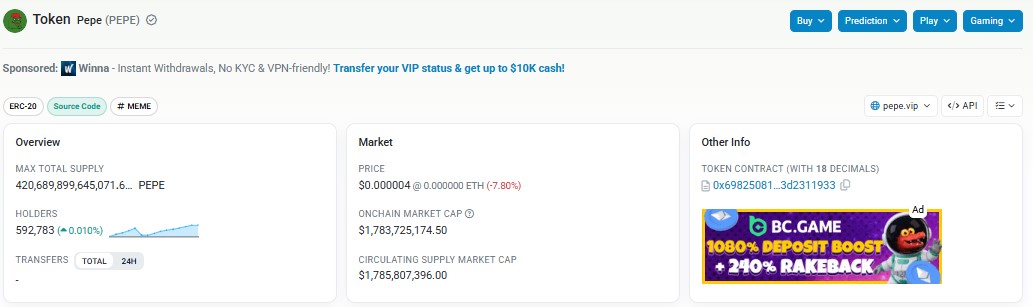
The PEPE holder distribution is top-heavy but less extreme than many peers.
The top 100 wallets control 76.72% of supply, the top five hold about 28%, and 18 holders own at least 1% each.
Whales number just 662 wallets, or 0.11% of holders, yet account for 89.96% of market cap, while 328,100 shrimp wallets hold only 0.04% combined. 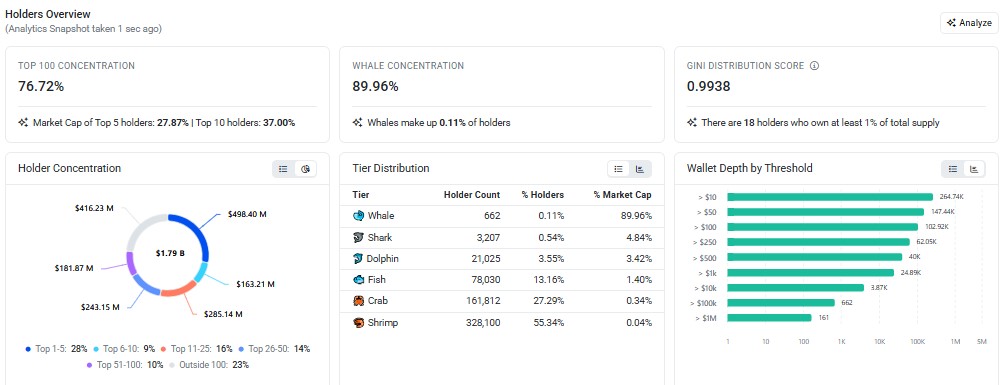
The Gini score of 0.9938 confirms the imbalance.
Large wallets can steady a rally, but their decisions can also swing the price quickly.
PEPE/USD Weekly Chart Analysis: Triangle Breakout
On the PEPE/USD weekly chart from TradingView, price spent most of the past year grinding lower inside a triangle, with sellers capping every bounce on a falling line and buyers defending a flat floor near 0.00000236.
That squeeze has now resolved upward. 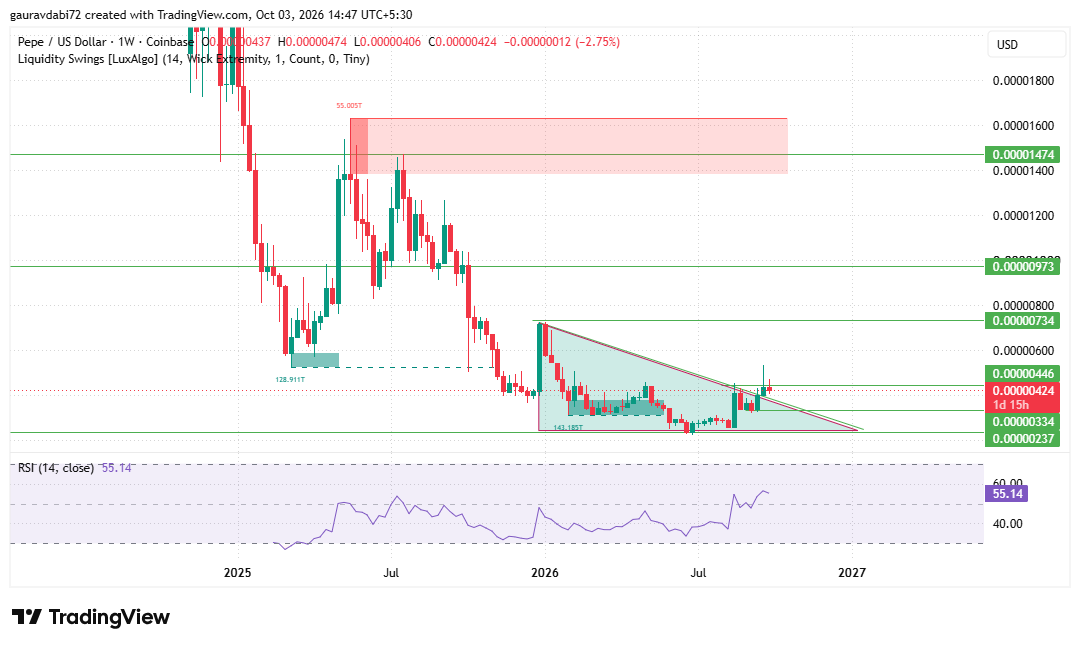
Price closed the latest week at 0.00000424 after a 2.75% dip, sitting just above the old trendline, and the RSI reads 55.14, a mild bullish tilt.
The PEPE triangle breakout still needs proof. The immediate hurdle is 0.00000446, only about 5% above current levels.
A weekly close above it that holds on a retest would confirm the move and open the way to 0.00000734, then 0.00000973.
The top mapped zone is 0.00001474, which sits inside a marked supply band. On the downside, PEPE support levels start at 0.00000334, about 21% below, with deeper support at 0.00000236.
Losing 0.00000334 on a weekly close would put the breakout in doubt.
How High Can PEPE Go in 2028? Scenarios From the Weekly Chart
Timing stays conditional. For the Pepe Price Prediction 2028, the path needs several weekly closes above each zone, and a recovery after 2027 could slip further out if spot volume stays light relative to futures.
Can PEPE Reach $0.00001 in 2028?
A move to $0.00001 would be roughly a 2.4-fold rise from today's price and sits just above the 0.00000973 zone on the weekly chart.
That makes it the most grounded headline level of the cycle, though still a scenario and not a forecast.
It would need a clean break of 0.00000446 and 0.00000734, steady spot demand, and a supportive meme market. A move to $0.0001, by contrast, would be about a 24-fold rise and lies far beyond every mapped zone.
Key Risks for PEPE Price in 2028
Leverage is the main risk, with open interest near 17% of market cap and futures volume far ahead of spot.
A failed retest of 0.00000446 could pull the price back toward 0.00000334. Whale concentration means a few wallets can move the market.
Neutral to mild RSI shows momentum is not yet decisive, and memecoins remain highly sensitive to Bitcoin direction and broader risk appetite.
Expert Opinion on PEPE Price Outlook
As per the analyst desk, the Pepe Price Prediction 2028 starts from a technically improved setup, since a multi-month triangle has broken to the upside.
The edge is still thin, though.
Heavy derivatives positioning and concentrated holders argue for patience until spot volume confirms.
In this PEPE price analysis, a weekly close above 0.00000446 is the first signal worth respecting, and 0.00000334 is the line that protects the thesis.
Conclusion
The Pepe Price Prediction 2028 depends on a clear sequence. Hold the breakout, clear 0.00000446 on a weekly close, then work through 0.00000734 and 0.00000973 with real spot volume behind each step.
A slip under 0.00000334 would reset the picture.
The Pepe crypto prediction stays cautiously constructive for now, and the Pepe future price will be decided by weekly closes and by how leverage unwinds, not by hype alone.
Disclaimer: This article is for informational purposes only and is not financial advice. Cryptocurrency markets are highly volatile, and price scenarios are conditional, not guaranteed. Always do your own research before making investment decisions.