
Is Pepe finally done with its long slide and ready for a fresh leg higher? After months of tight, uneventful trading, the meme coin has started to push out of the structure that held it down, and buyers appear to be gaining the upper hand.
That change in tone has put the Pepe price prediction 2027 back on traders' radar.
The key question is whether PEPE can convert this early strength into a lasting trend, or whether the move stalls before it truly gets going.
Pepe Price Today: Market Cap, Supply, and Volume
PEPE is trading near $0.000004388, up 1.64% on the day, according to CoinGlass. Per DefiLlama data, market capitalization stands at $1.842 billion, matching the fully diluted valuation, with the full 420.69 trillion PEPE supply already in circulation.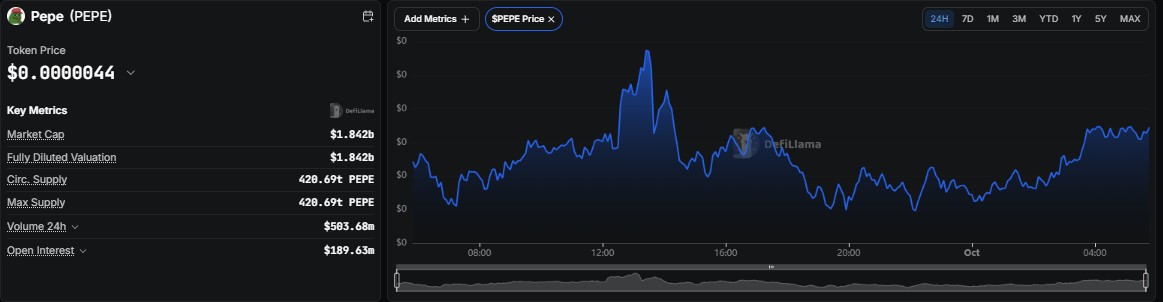
With no further tokens left to unlock, supply-side pressure is largely off the table. Activity is heavily skewed toward derivatives.
Pepe's 2026 Journey: From Compression to Recovery
Per Coinglass, PEPE is up 8.88% year to date, a notable turn for a token that is still down 52.92% over one year. 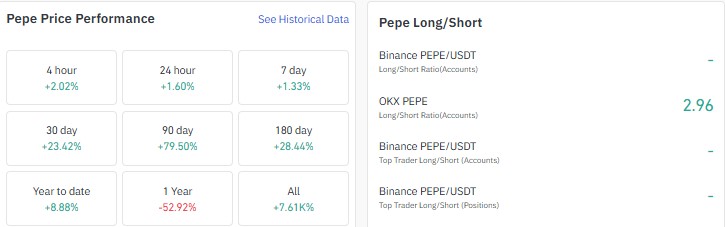
The climb has built in layers. The 180-day gain stands at 28.44%, the 90-day gain at 79.50%, and the 30-day gain at 23.42%, while the last seven days added a calmer 1.33%.
The OKX long-short account ratio for PEPE reads 2.96, per Coinglass, so longs outnumber shorts by nearly three to one on that exchange.
That points to constructive market sentiment, though it also leaves the crowd exposed if the breakout stalls.
The heavy lifting clearly came over the past three months, with the pace now cooling into a steadier advance.
TradingView weekly data tells the same story. PEPE spent most of 2026 drifting sideways beneath a falling trendline and above a flat base, then pushed out of that structure in late summer. Pepe price prediction 2027
Pepe Long-Short Ratio and Liquidations: Who Is Getting Squeezed?
Liquidations were two-sided over 24 hours, totaling $419.02K, with $234.13K in longs and $184.89K in shorts. The 12-hour reading shows $107.19K, split between $69.33K in longs and $37.86K in shorts. 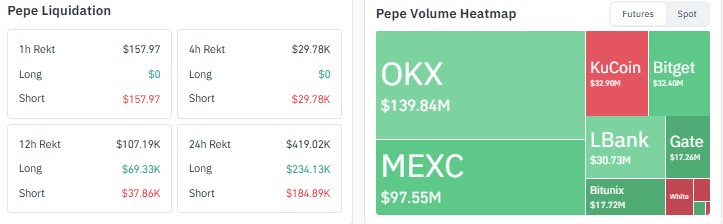
In the latest four hours only shorts were hit, for $29.78K, with no long liquidations at all.
The sequence suggests an early shakeout of longs followed by a push that squeezed late sellers.
The amounts are modest for a market of this size, so it reads as healthy turnover rather than forced selling.
Coinglass shows 24-hour futures volume of $378.35 million against $99.31 million in spot, and OKX leads the futures heatmap at $139.84 million, followed by MEXC at $97.55 million.
Pepe Open Interest: Is Leverage Backing the Move?
Open interest stands at $327.49 million, according to Coinglass. The chart shows it near $230 million in mid-May, sliding to roughly $130 million in June, then rebuilding through summer before jumping past $300 million in late August. 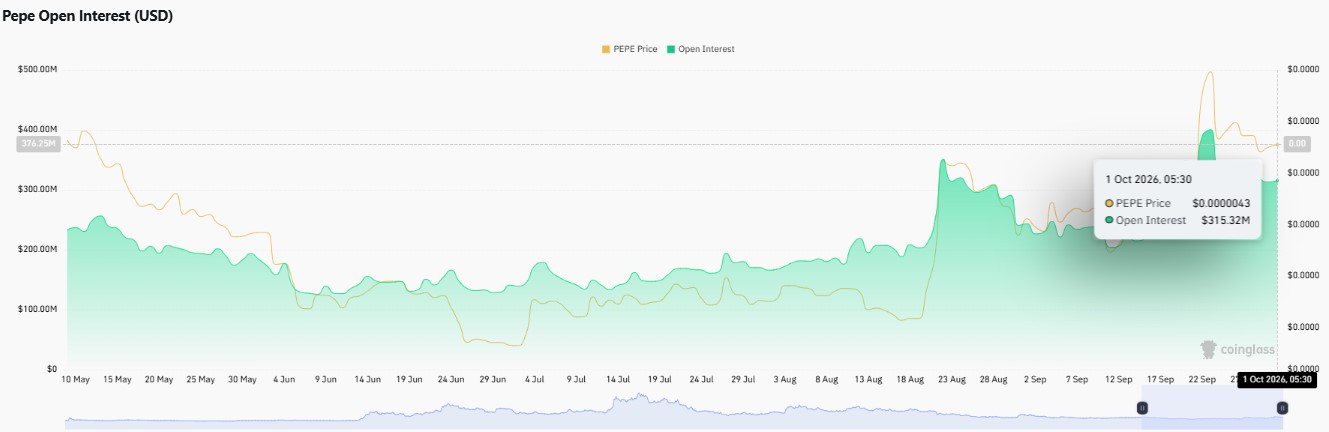
It spiked to about $400 million around 22 September and has since eased to roughly $315 million at the early-morning reading.
In other words, leverage has more than doubled from the June trough while price recovered.
With futures volume running at nearly four times spot, traders are clearly expressing their views through derivatives.
Open interest holding a firm while the price stays above $0.00000446 would confirm conviction, whereas open interest climbing while the price stalls beneath it would raise the odds of a leverage flush.
PEPE Weekly Chart Analysis:
Per TradingView weekly chart data on the Coinbase pair, PEPE spent most of 2026 in a consolidation phase shaped like a descending triangle, with a flat base near $0.00000237 and a falling upper trendline drawn from the January high. 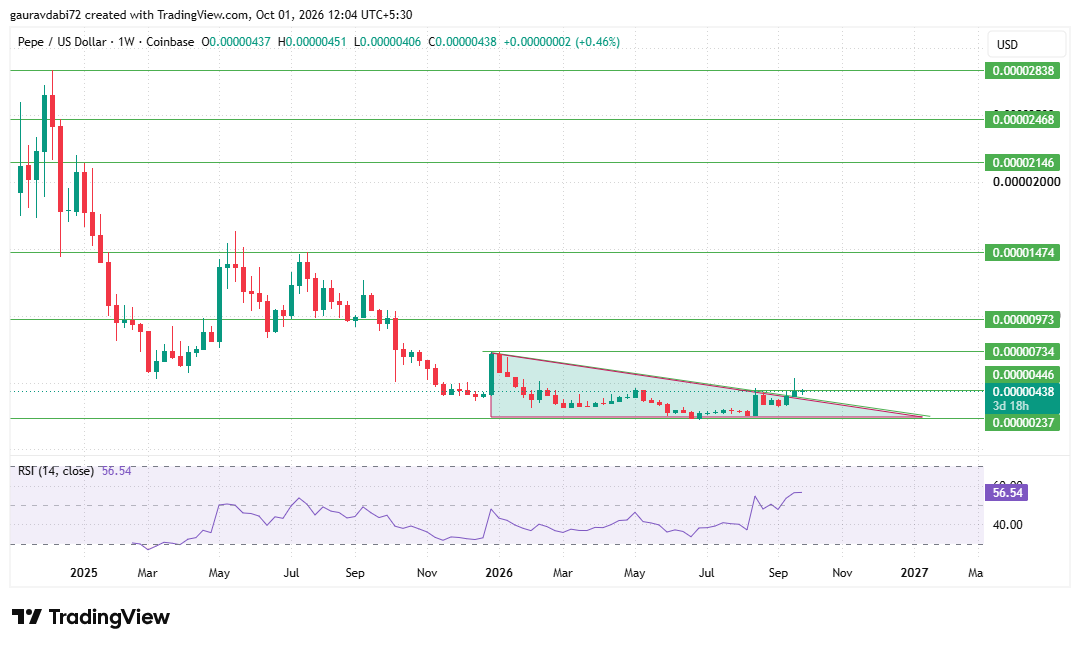
In late summer, a strong green weekly candle drove price through that trendline, and the retest that followed held, which is the classic way a breakout earns credibility.
Price is now pressing into immediate resistance at $0.00000446, only about 1.6% above current levels.
The latest weekly candle probed just beyond it with a high of $0.00000451 before settling at $0.00000438.
RSI at 56.54 has moved above the 50 midpoint, which tells us momentum has shifted in the bulls' favor without reaching overbought territory, leaving room for further expansion.
Mapping the support and resistance levels is straightforward from here. A weekly close above $0.00000446 that holds on a retest would open $0.00000734, the January high and the top of the old triangle, roughly 67% higher.
Beyond that, the ladder runs through $0.00000973, $0.00001474, $0.00002146, $0.00002468 and $0.00002838.
On the downside, a weekly close back below the old trendline, which sits just beneath the current price, would mark the breakout as a failure, with the $0.00000237 base acting as critical support, about 46% lower.
Pepe Monthly Outlook:
The monthly chart tells the same story with more authority. Candles shrank through the first half of 2026 inside the triangle, a low printed on the base around mid-year, and the last few monthly candles have closed higher and cleared the falling trendline.
Price now sits at $0.00000439, directly beneath the $0.00000446 horizontal level. Monthly RSI at 28.26 is the most striking reading. 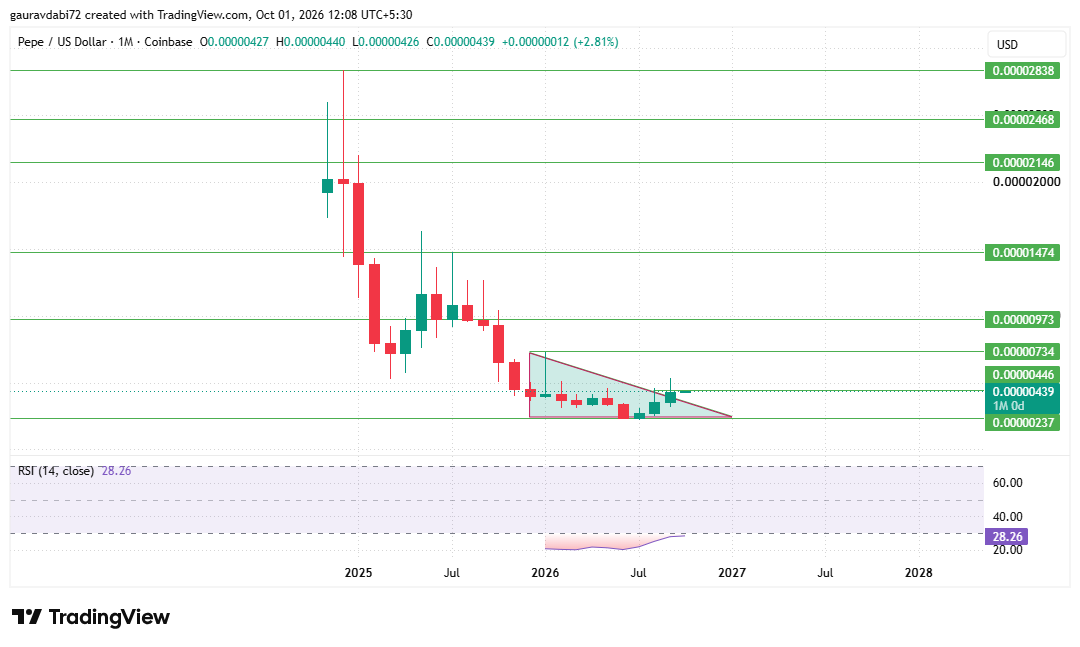
It is deeply depressed yet turning upward, a profile that often accompanies the early stage of a recovery rather than its end, though a low RSI alone confirms nothing.
A monthly close above $0.00000446 would validate the breakout on the timeframe that matters most and open the same ladder of levels, from $0.00000734 up to $0.00002838.
That upper end sits roughly 6.5 times above the current price and would imply a market cap near $12 billion at the current supply, so it belongs to a long-range, momentum-driven scenario.
What Needs to Change for PEPE to Climb Toward Higher Levels?
Several conditions need to line up. A weekly and monthly close above $0.00000446 comes first, since a wick through it, like the one seen this week, is not enough.
The retest of that level then has to hold as support. Open interest should stay firm instead of collapsing, and spot volume has to grow relative to futures, because a derivatives-led rally is easier to unwind.
Weekly RSI needs to hold above the 50 midpoint, and monthly RSI must climb out of its depressed zone to show the recovery is broadening.
Pepe Price Prediction 2027: Base, Bull, and Bear Scenarios
The PEPE price forecast for 2027 splits into four conditional paths, each tied to how price behaves around the breakout level.
Key Risks Facing Pepe in 2027
The first risk is a failed breakout. Price has only just tested $0.00000446, and a slide back inside the triangle would undo the recent progress quickly. Positioning is the second concern.
With a 2.96 long-short ratio on OKX and open interest more than double its June low, a stalled move could trigger a leverage flush.
Third, the rally leans on derivatives, since futures volume is nearly four times spot. The last is history.
Earlier recovery attempts in 2025 faded, and the token remains down 52.92% over one year.
The distance to the $0.00000237 base is also wide, so a full breakdown would be costly.
Expert Opinion: Analyst Desk View on PEPE
As per the analyst desk, PEPE offers one of the cleaner structural setups among large meme assets right now.
A long consolidation, a breakout through the descending trendline, a retest that held, and an RSI back above the midpoint all point in the same direction on the weekly chart, while the monthly chart backs it with an improving, though still early, recovery.
The desk's focus is a confirmed close above $0.00000446. Because the move is leverage-heavy, follow-through needs to be earned with spot participation; otherwise, rallies can fade quickly. Discipline around levels matters more than conviction.
Conclusion
Pepe price prediction 2027 enters 2027 with its best technical footing in a long time.
The descending triangle has resolved higher, momentum has turned constructive on the weekly chart, and leverage has rebuilt alongside price.
A confirmed close above $0.00000446 could open the path toward $0.00000734 and the levels beyond, while a slide back below the old trendline would put the breakout in doubt. Until then, caution is advised and confirmation matters more than excitement.
Disclaimer: This article is for informational and educational purposes only and does not constitute financial, investment or trading advice. Cryptocurrency prices are highly volatile, and all price levels and scenarios discussed are conditional views, not guarantees. Readers should assess their own risk tolerance before making any decision.