

Neon EVM just did something most charts don't do overnight. NEON ripped past 227% in a day, and the question isn't whether it moved. It's whether it holds.
This NEON price prediction breaks down the surge, the RSI reading, and where support sits next. Traders comparing tokens can check the crypto price prediction hub before going deeper here.
Neon EVM brings Ethereum-style contracts onto Solana. Suddenly, it's back in every trader's feed.
Research Snapshot (09:00 UTC, September 23, 2026)
Sudden price. That combination deserves a second look.
Current Market Snapshot
NEON traded near $0.04531 at 09:00 UTC on September 23, 2026, per CoinMarketCap. Market cap stayed small against a much larger diluted value.
Circulating Supply
Circulating supply reads 239.46 million NEON of a fixed one billion total. Some trackers cite a higher figure near 431 million, so the source matters before comparing targets.
Why Is NEON Moving Right Now
Volume jumped 7,285% in 24 hours, landing near $3.21M. That rarely comes from one buyer.
Broader altcoin rotation looks like the driver, not a NEON-specific announcement. Some of that capital also chases presale and IDO listings for the same speculative dollars.
Technical Analysis: RSI
The 14-period RSI sits at 94.03. Readings above 70 flag overbought conditions. 94 is deep euphoria.
Technical Analysis: Trend Structure
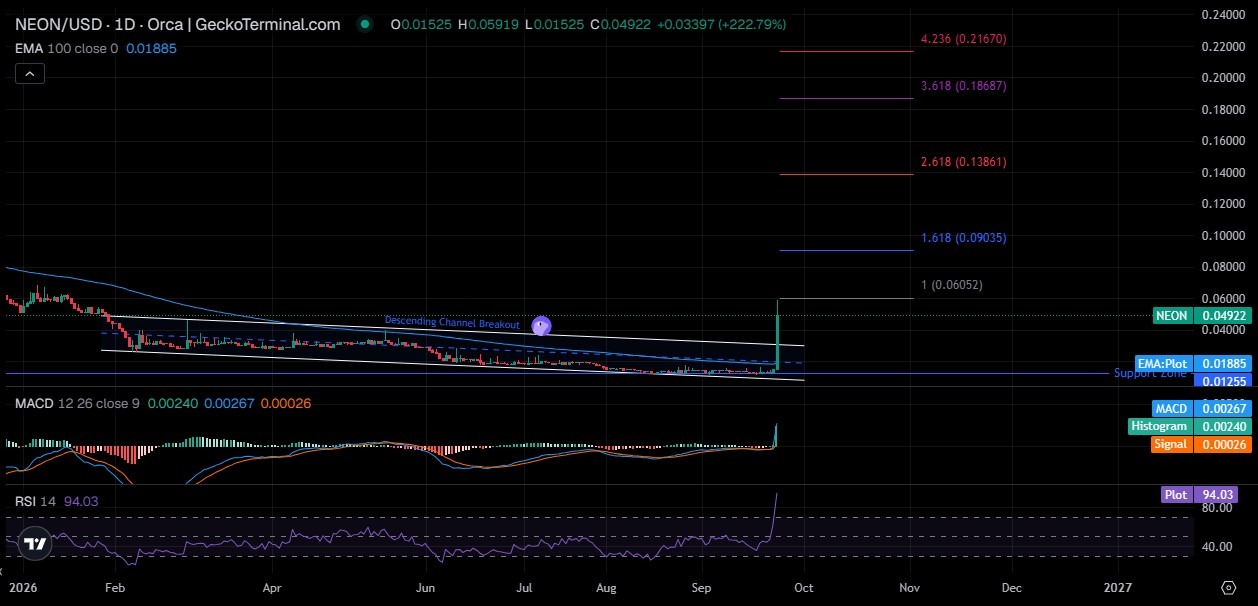
Price sat in a falling channel for months before breaking out hard. The candle opened near $0.01525, reached $0.05919, then settled near $0.04922, a single-day move of roughly 222.79%.
Technical Analysis: MACD
The MACD line reads 0.00267 against a signal of 0.00026. A widening, positive histogram confirms the breakout rather than contradicting it. GeckoTerminal shows the same pattern on the daily pool chart.
Breakout and Breakdown Levels
A trading move above $0.0605 on strong volume opens a path toward $0.0903. Losing $0.0125 undoes the structure.
Support and Resistance
Support sits between $0.0125 and $0.0189, the old channel ceiling now acting as a floor.
Resistance stacks near $0.0605, then $0.0903, drawn from Fibonacci extensions.
Volume and Liquidity
A 7,285% volume spike beside a 227% move is a healthy pairing. But one session doesn't prove it sticks. Reviewing crypto exchange listings shows where that volume sits.
Network Activity and Adoption
A price surge doesn't mean network usage caught up. Holders near 16.11K show fresh interest, but on-chain activity decides if this rally holds.
NEON Price Prediction 2026
Long-Term Outlook (2027 to 2030)
A bull run near $0.70 implies a market cap far above current levels. That's a big ask.
What Could Invalidate the Outlook
A move below $0.0125 on strong sell volume unwinds the breakout. A move above $0.0605 confirms it and opens the door toward $0.0903. For a similar decision-point setup, this bitcoin price analysis is worth a look.
A Lesson From Old Forecasts
Early 2024 predictions placed NEON far above $4. Actual 2025 performance landed nowhere close. Long-range numbers built without checking supply first tend to age badly.
What Traders Should Watch Next
Whether volume stays elevated or fades
RSI cooling off from overbought
A confirmed move above $0.0605
Support retention near $0.0125
Holder trend and the August 2027 unlock
Disclaimer
This article is for informational purposes only and does not constitute financial, investment, or trading advice. Cryptocurrency markets are highly volatile, and prices can move sharply in either direction. Data referenced here reflects a snapshot near 09:00 UTC on September 23, 2026, and may have changed since publication. Independent research is recommended before any financial decision.