
Solana Price Prediction: SOL Breakdown or Trap Next?
It just closed its best September in five years, and Q4 has historically been kind to it too. This Solana Price Prediction looks at whether price can clear $120.18 and push toward $150.28.
Market data was checked on September 23, 2026
Market Overview
SOL Best September in 5 Years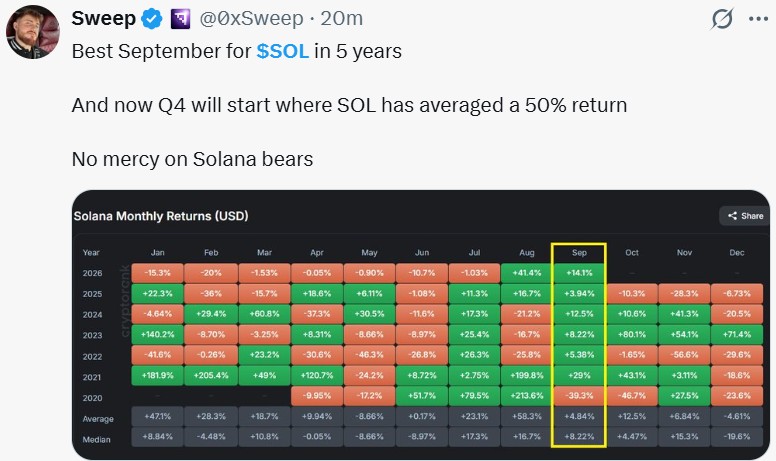
Source: Data From X
A social post from trader Sweep, citing a monthly-returns table, claimed the token just posted its best September in five years and that Q4 has historically averaged strong returns.
Chart: Technical Analysis
Price broke out of a rising channel in mid-September following a bullish crossover, rallying sharply before pulling back to consolidate just under the $120.18 resistance zone.
Before the breakout, price had spent most of August grinding sideways inside that channel, with the shorter crossing above the longer one right near the lower boundary, an early signal that momentum was starting to shift before the actual price move confirmed it.
The rally candle that followed cleared the upper trendline in a single move, pushing price well above and leaving a visible gap between spot price and the EMA support zone below.
The current pullback has stayed shallow so far, holding above the old resistance near $110.25 rather than slipping back inside the prior range, which is generally read as a sign the breakout structure is still intact.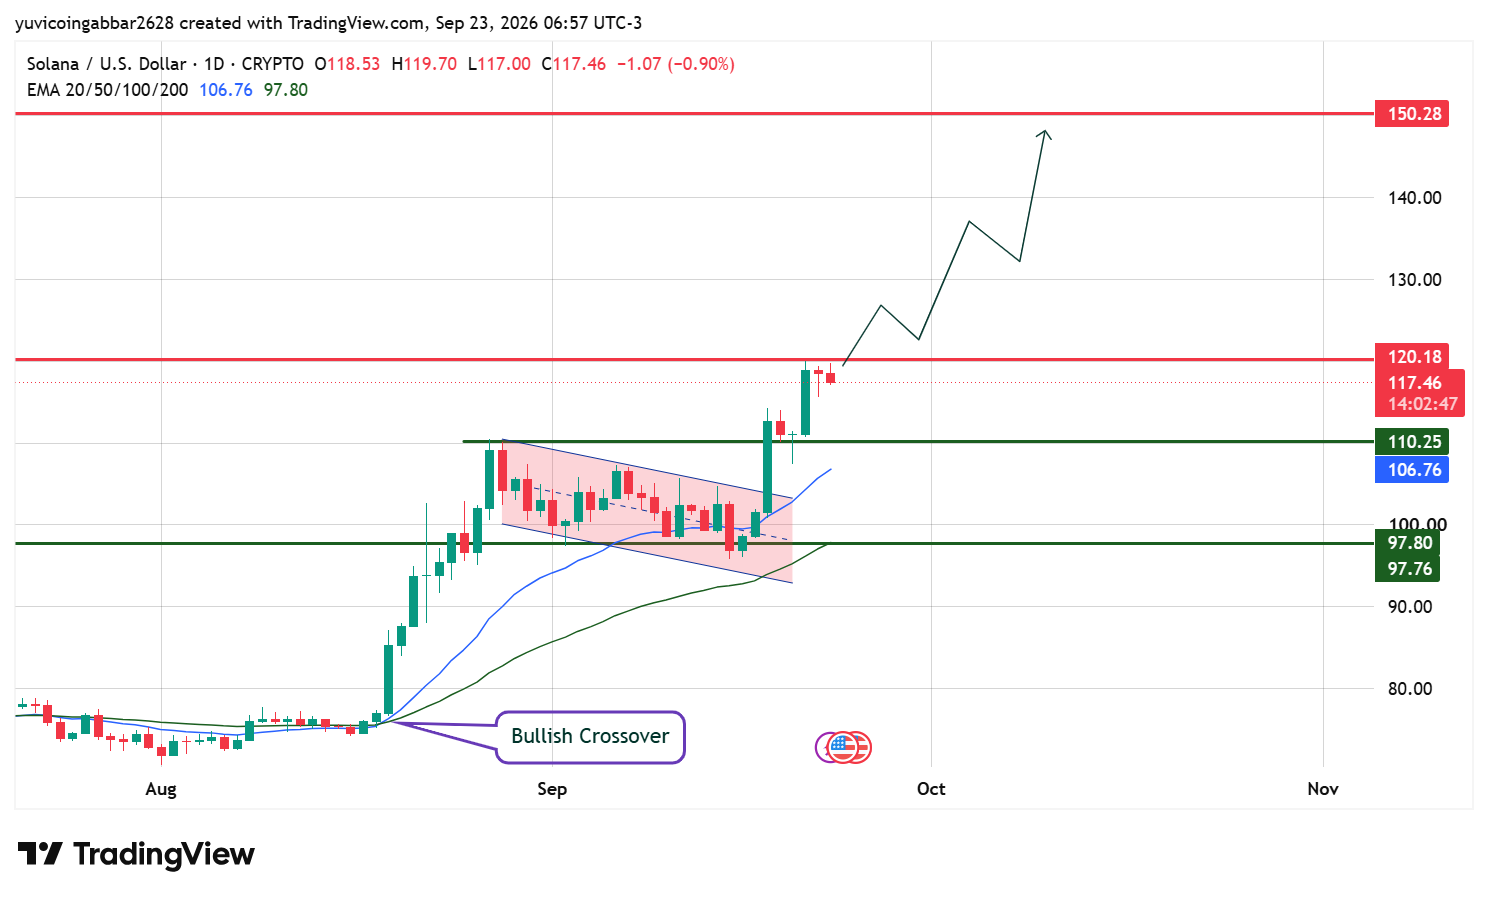
Bull Case vs Bear Case
Bull case: Holding above $110.25 and clearing $120.18 would confirm the channel breakout is continuing, opening the path toward $150.28.
Bear case: A close back below $110.25 would risk a retest of the EMA support zone near $97.80, putting the breakout in doubt.
Can It Reach $150.28?
$150.28 is the highest marked resistance. Reaching it would need a confirmed close above $120.18 first, plus continued follow-through into Q4.
Expert View
The channel breakout and crossover point to genuine momentum, but the pullback under $120.18 shows sellers defending that zone for now. A close above it is the key confirmation to watch.
Disclaimer
This piece is for informational purposes only and isn't financial advice. Crypto markets can move sharply, so do independent research before acting on any level discussed here.