

Is Ethereum's climb back toward $2,700 the start of a genuine 2026 breakout, or just another rally that fades before it can hold?
Buyers have been steadily reclaiming ground after a rough first half of the year, and the Ethereum price prediction 2026 conversation is shifting from survival mode to real upside talk.
On-chain supply is tightening, staking demand is climbing, and the weekly chart is now testing a level that could decide whether will Ethereum reach $4000 stops being a hypothetical and starts being a real conversation.
ETH Price Today: Where Does Ethereum Stand Right Now?
Ethereum is trading near $2,683.87, down about 0.38% on the day, according to Coinglass data.
The token's market capitalization sits close to $327.36 billion on a circulating supply of roughly 122.08 million ETH, with combined spot and futures turnover staying heavy at around $33.84 billion in futures volume against $1.92 billion in spot activity over the past 24 hours.
That backdrop is the starting point for any Ethereum price prediction 2026, since valuation, liquidity, and positioning all feed into what happens next.
How Has Ethereum Performed Across Timeframes?
Short-term performance shows a token recovering in stages. The token is up close to 2.68% over the past week and 6.99% over the month, with a sharp 70.62% gain over 90 days, though it remains down about 9.61% year to date and 30.69% over the past year.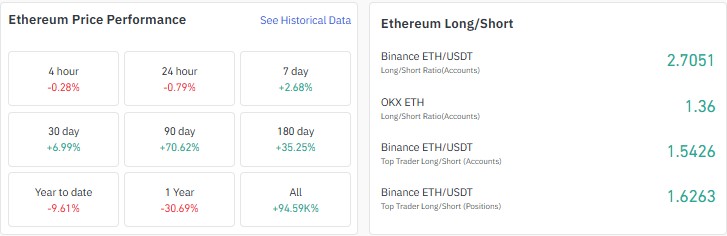
The long-short ratio is leaning long across major venues, with Binance's ETH/USDT reading near 2.70 and OKX close to 1.36, while Binance's top-trader accounts sit above 1.5.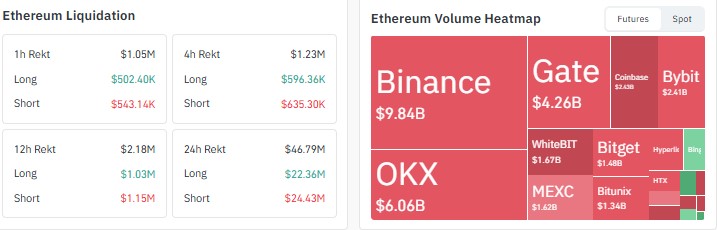
That leverage has come with volatility. Coinglass data shows roughly $46.79 million in liquidations over the past 24 hours, fairly evenly split between longs and shorts, a sign the move higher hasn't come without two-way pressure.
What Does Ethereum Open Interest Tell Traders?
Open interest across derivatives venues stands near $34.15 billion, according to Coinglass, well off the highs above $40 billion seen in late 2025 but recovering steadily from lows near $20 billion earlier this year as price has climbed back.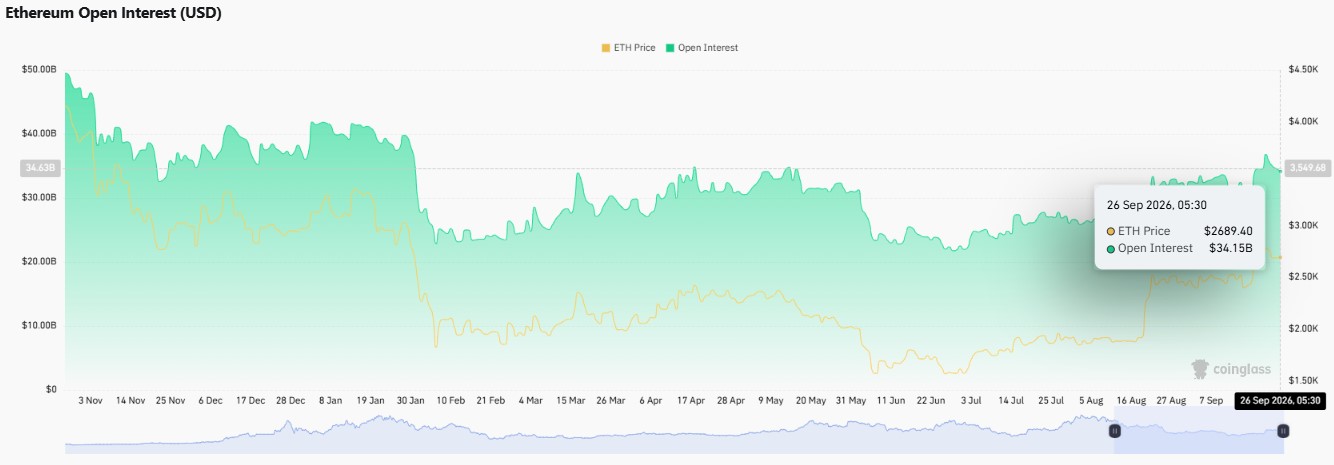
That rebuild in open interest alongside a firming price is generally read as fresh positioning returning to the market rather than just short covering.
Why Is Ethereum's Exchange Supply Shrinking?
Away from derivatives, the more interesting story sits in exchange supply and staking. 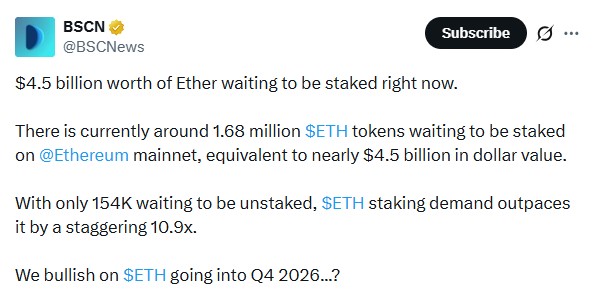
Data cited by BSCNews shows just 3.49% of the token's total supply now sitting on exchanges, with about 1.16% having moved off exchanges in the past four months alone, even as the network's staking ratio sits at historic highs.
That trend is echoed by a separate figure showing roughly 1.68 million ETH, worth close to $4.5 billion, currently queued to be staked, against just 154,000 ETH waiting to unstake, a gap of nearly 11 times.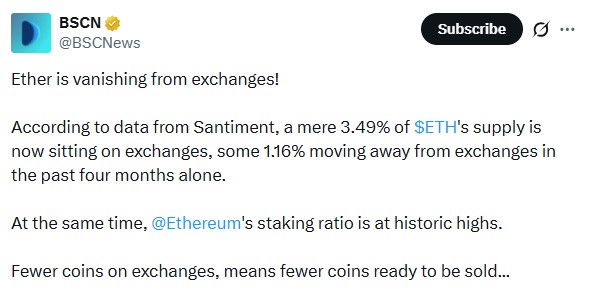
Fewer coins sitting on exchanges generally means fewer coins readily available to sell into a rally.
Ethereum Weekly Chart: What Is TradingView Showing?
The weekly chart shows Ethereum price prediction 2026 working inside an ascending channel that has been building since the token bottomed earlier in the year.
Price is now pressing against the upper boundary of that channel, with the latest weekly candle closing near $2,681, up 1.38% for the week.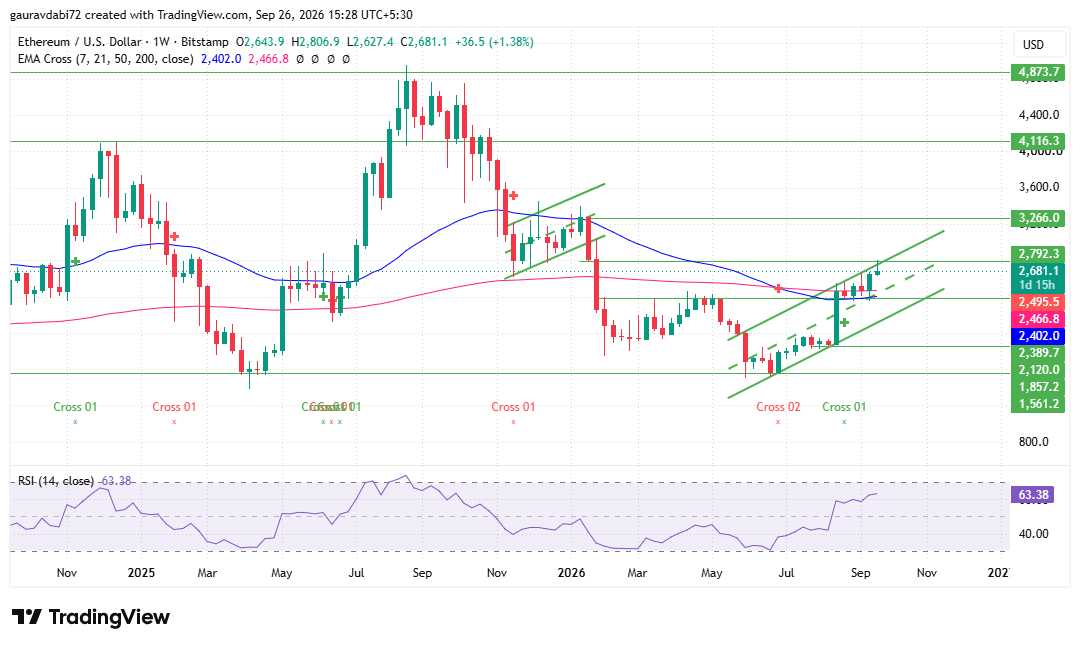
A close that holds above the $2,800 area would put the channel breakout in play, opening a path toward the next levels at $3,266 and eventually $4,116 and $4,873 if momentum extends that far.
The EMA cluster sits just below current price in the $2,400 to $2,467 zone, with the shorter-term average still closing the gap toward the longer ones, a setup that often precedes a clearer EMA crossover if price holds up.
This kind of Ethereum weekly chart analysis points to a market at a decision point rather than one already resolved.
RSI near 63 shows room left before the move looks overbought.
On the downside, a failure to hold above the channel would put support at $2,389, then $2,120, with deeper levels at $1,857 and $1,561 well below current structure.
What Could Ethereum Price Do Next?
What Are the Key Risks to Watch?
Leverage remains the main swing factor to watch. A long-heavy positioning skew combined with a 24-hour liquidation total near $47 million shows the market is already reacting fast to price swings in both directions.
The channel breakout above $2,800 is not yet confirmed, and a rejection there could send price back toward the lower boundary of the range.
Broader crypto risk sentiment and any pickup in exchange inflows would also be worth tracking, since the current bullish case leans heavily on supply staying off exchanges.
Expert Opinion: What Does the Analyst Desk Think?
As per the analyst desk, the mix of tightening exchange supply, staking demand outpacing unstaking by roughly 11 times, and price pressing against the top of a multi-month ascending channel points to a market building toward a decision point rather than one that has already made it.
A confirmed close above the channel's upper boundary would be the clearer signal that the next leg higher is underway.
Conclusion
Ethereum's setup into the back half of 2026 looks constructive but not yet resolved, with exchange supply shrinking and derivatives positioning rebuilding even as the weekly chart sits right at a key breakout zone.
Whether the token pushes toward $3,000 and beyond will likely come down to how it handles the boundary it is testing right now, and that same evidence is what should guide anyone weighing is Ethereum a good investment in 2026.
Disclaimer: This article is for informational purposes only and should not be treated as financial or investment advice. Cryptocurrency markets are highly volatile, and readers should conduct their own research before making any investment decisions.





