

Ethereum Price Prediction: BlackRock Buying Meets $3,001 Target
Ethereum's chart is flashing a pattern that trend traders pay close attention to, and this read breaks down exactly what happens once either side of the current range gives way.
This is a purely technical and data-based read on Ethereum, not a personal position or financial advice.
Ethereum Price Today
ETH is priced at $2647.73, down 3.12% over the past 24 hours. Futures volume for the period is a massive $53.99B against spot volume of $3.33B, meaning derivatives trading is driving most of the current activity.
Market cap sits at $323.43B, with open interest at $34.90B. Circulating and total supply both stand at 122.07M ETH, with no fixed max supply. Source: CoinGlass, September 24, 2026.
Ethereum News Today
Whale Factor posted that BlackRock ETF clients scooped up $50.8M worth of ETH in a single day, framing it as institutional capital building steadily rather than waiting for a deeper dip. 
The post added that while Bitcoin brought Wall Street into crypto, Ethereum is where that institutional money is now choosing to build its position.
Source: Whale Factor on X, September 24, 2026.
Quick Take
CMP: $2650.86 (1-hour Binance ETHUSDT perpetual chart)
Bullish trigger: close above $2704.53
Bearish trigger: close below $2566.83
Data timestamp: September 24, 2026
Risk note: futures volume dwarfing spot volume means either trigger level could be exaggerated or leverage-driven wicks
Ethereum Technical Analysis
On the 1-hour ETH/USDT chart, price has been sliding lower inside a clean descending channel since rolling over from its recent highs. 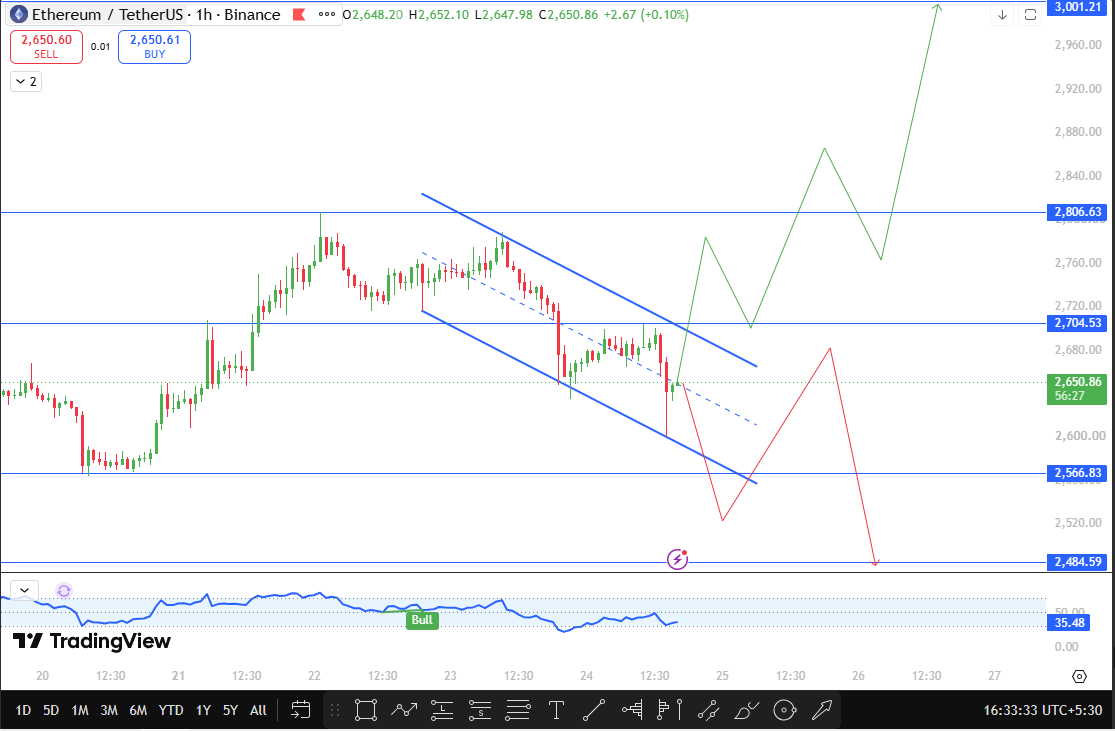
Both boundaries of the channel are sloping down in tandem, and the price is currently sitting closer to the lower half of that range.
The oscillator is reading 35.48, having touched a Bull signal earlier in the move before cooling off again, which suggests sellers still hold a slight edge for now even as buying attempts keep showing up along the way.
If the price closes above $2704.53, that breaks the pattern's upper boundary and changes the near-term structure back toward bullish, opening a path toward $2806.63 and then $3001.21.
If the channel holds instead and the price closes below $2566.83, the next support to watch is $2484.59.
Ethereum Support and Resistance Levels
Bull Base Bear Outlook
In the bullish case, ETH breaks the descending channel, closes above $2704.53, and pushes toward $2806.63 before eyeing $3001.21, with steady institutional ETF buying adding support underneath.
In the base case, price keeps chopping between $2566.83 and $2704.53 while the market weighs the BlackRock inflow news against the still-active channel structure.
In the bearish case, the channel holds firm, ETH closes below $2566.83, and the price slides toward $2484.59 as sellers stay in control.
Ethereum price prediction Risks
The heavy skew toward futures volume over spot volume raises the odds of sharp, leverage-driven moves that overshoot both the channel boundaries and the key trigger levels named here.
Single-day ETF flow figures like the BlackRock purchase can also be noisy, and a broader shift in risk sentiment across crypto could easily outweigh this specific signal.
Glossary
Descending Channel: A price pattern formed by two parallel, falling trendlines that contain price action within a downward-sloping range.
Structure Flip: A key level where a breakout would change the prevailing trend bias from bearish to bullish, or vice versa.
Open Interest: The total value of outstanding derivative contracts on an asset that remain unsettled.
Disclaimer
This article is for informational purposes only and does not constitute financial advice. Cryptocurrency markets are highly volatile. Always do your own research before making investment decisions.





