

VET has just given back part of a strong run, and traders are asking whether the dip is a routine pullback or the start of something deeper.
The token slipped out of the rising pattern that carried it higher, yet it still holds above key moving averages.
That tension is driving the VeChain price prediction discussion, with buyers and sellers now fighting over a support zone.
What Is the VeChain (VET) Price Today?
According to Coinglass, the token price today is $0.008858, down 7.82% in 24 hours, with a market capitalization of $763.16M and spot volume of $7.41M.
Circulating supply is 85.98B tokens, equal to total supply and against an 86.71B maximum, so almost the full supply is already in the market.
Why Is VeChain Price Down Today Despite a Strong Month?
Why is VeChain price down today? Coinglass data shows a 7.83% drop over 24 hours and 2.41% over four hours, yet the token is still up 23.58% over seven days, 56.65% over 30 days, and 99.36% over 90 days.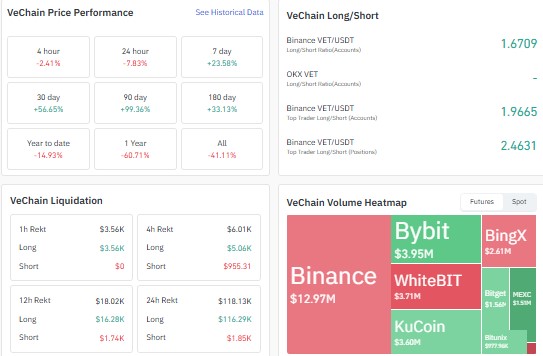
The longer view is weaker, with VET down 14.93% year to date and 60.71% over one year, so today's slide looks like a pullback inside a bigger recovery attempt. Trader positioning leans long.
The Binance VET/USDT long-short ratio reads 1.67, top trader accounts sit at 1.97, and top trader positions at 2.46.
Long liquidations account for $116.29K of the $118.13K liquidated over 24 hours, with shorts at just $1.85K, so the drop has mostly flushed overleveraged buyers.
Is VeChain Open Interest Still Elevated After the Drop?
$VET open interest stands at $35.32M on Coinglass, and the chart reading at 05:30 on 24 September had it at $35.81M with a price at $0.0088. 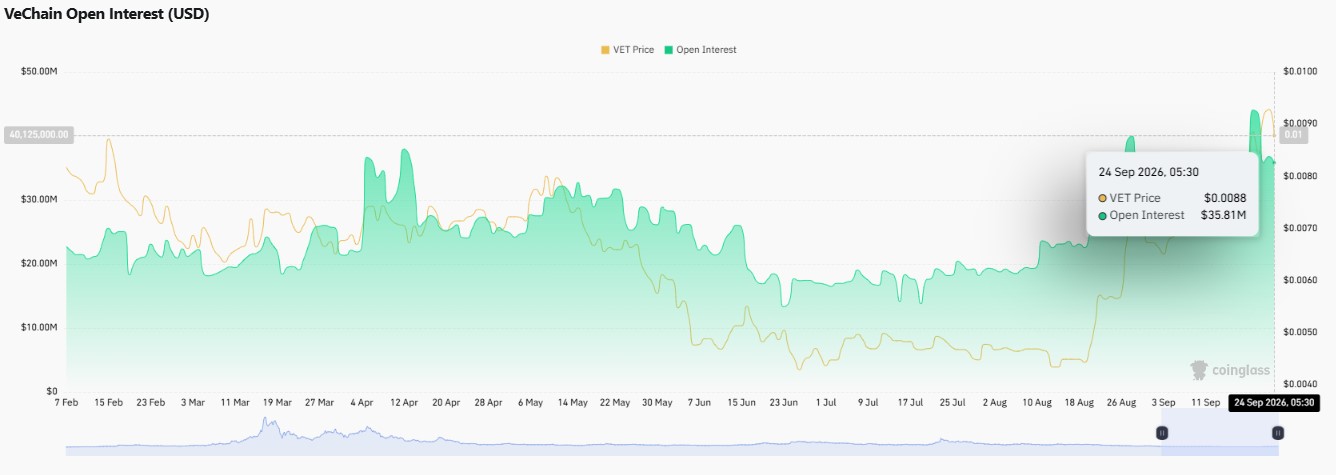
That is roughly double the $20M or so seen through July and August, with brief spikes above $40M in recent weeks.
Futures trading volume of $31.10M is about four times spot volume, so derivatives still steer short-term swings, though open interest is only about 4.6% of market cap.
VeChain 4-Hour Chart Analysis: Can Buyers Defend $0.008783?
Per TradingView chart data on the Coinbase VET/USDC pair, this 4-hour chart analysis shows a climb inside an ascending channel from mid-September, topping out near $0.009920 before sellers pushed it back. 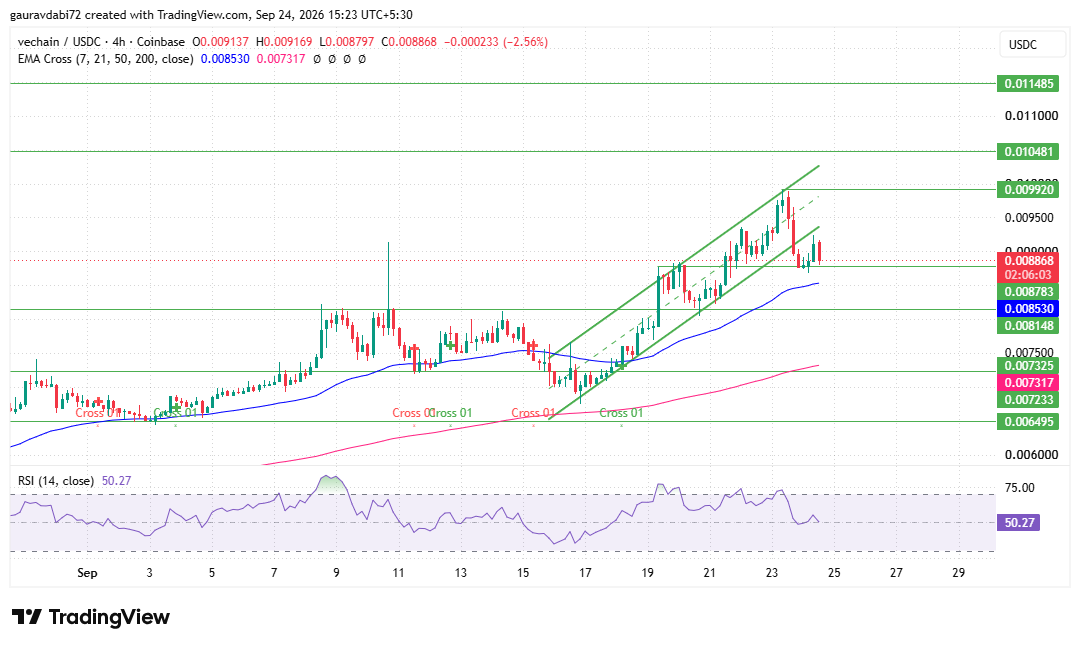
The latest drop broke through the lower channel line, so the $VET ascending channel breakdown is now the main technical fact.
Price sits at $0.008868, right on the $0.008783 support level. Support beyond that sits at $0.008148, $0.007233, and $0.006495.
Price is still above the 50 EMA at $0.008530 and the 200 EMA at $0.007317, a moving average support structure that keeps the wider trend intact for now.
If buyers hold $0.008783, resistance sits at $0.009920, $0.010481, and $0.011485.
These $VET support and resistance levels make $0.008783 the line that decides the next move.
What Could the VeChain Price Prediction Look Like Next Week?
For the $VET price prediction next week, $0.008783 and the 50 EMA set the path.
What Could Deepen the Pullback?
The channel breakdown leaves room for lower highs. Positioning is still long-heavy, so another flush is possible, and the one-year decline shows plenty of overhead supply on any bounce.
Is the VeChain Dip a Buying Zone? Analyst Desk View
As per the analyst desk, the token looks corrective rather than reversed while it holds above the 50 EMA and 200 EMA.
Buyers still need to defend $0.008783 to avoid a deeper test of $0.008148.
Conclusion
The VeChain price prediction depends on $0.008783. A hold opens at $0.009920, while a close below it shifts focus to $0.008148 and the 50 EMA zone.
Disclaimer: This article is for informational purposes only and is not financial advice. Crypto prices are highly volatile, so consult a qualified advisor before investing.





