

US Oil Price Prediction: Will Hormuz Push WTI to $104?
US oil is trading about 12% below its mid-September high, yet a fresh Strait of Hormuz report keeps supply worries alive.
That frames this US oil price prediction and the wider WTI price prediction September 2026 outlook.
The today price is $92.75 per barrel, up 0.05% as of 12:11 IST.
The crude oil price today sits well under the September peak, and the price today shows a market that has barely moved.
Live Market Data
Source: TradingView (TVC CRUDE and FXCM WTI CFD), as of September 24, 2026, 12:11 to 12:21 IST.
US Oil News Today: Hormuz Talks Stall
The latest US oil news is a social media post saying the US rejected an Iranian proposal to reopen the Strait of Hormuz. Iran reportedly asked the US to lift its naval blockade and release frozen assets. The report is unconfirmed.
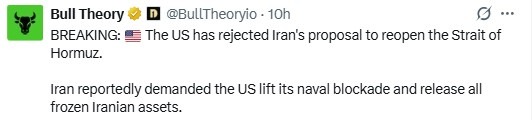
For readers following news today, the reaction is small, with the price up only 0.05%.
Source: Data taken from @BullTheoryio, X account, as of Sep 24, 2026.
4H Technical Analysis
This crude technical analysis uses the 4-hour WTI CFD chart from FXCM, captured at 12:21 IST (UTC+5:30) on September 24, 2026. The current candle was still forming, with a last price of $92.562.
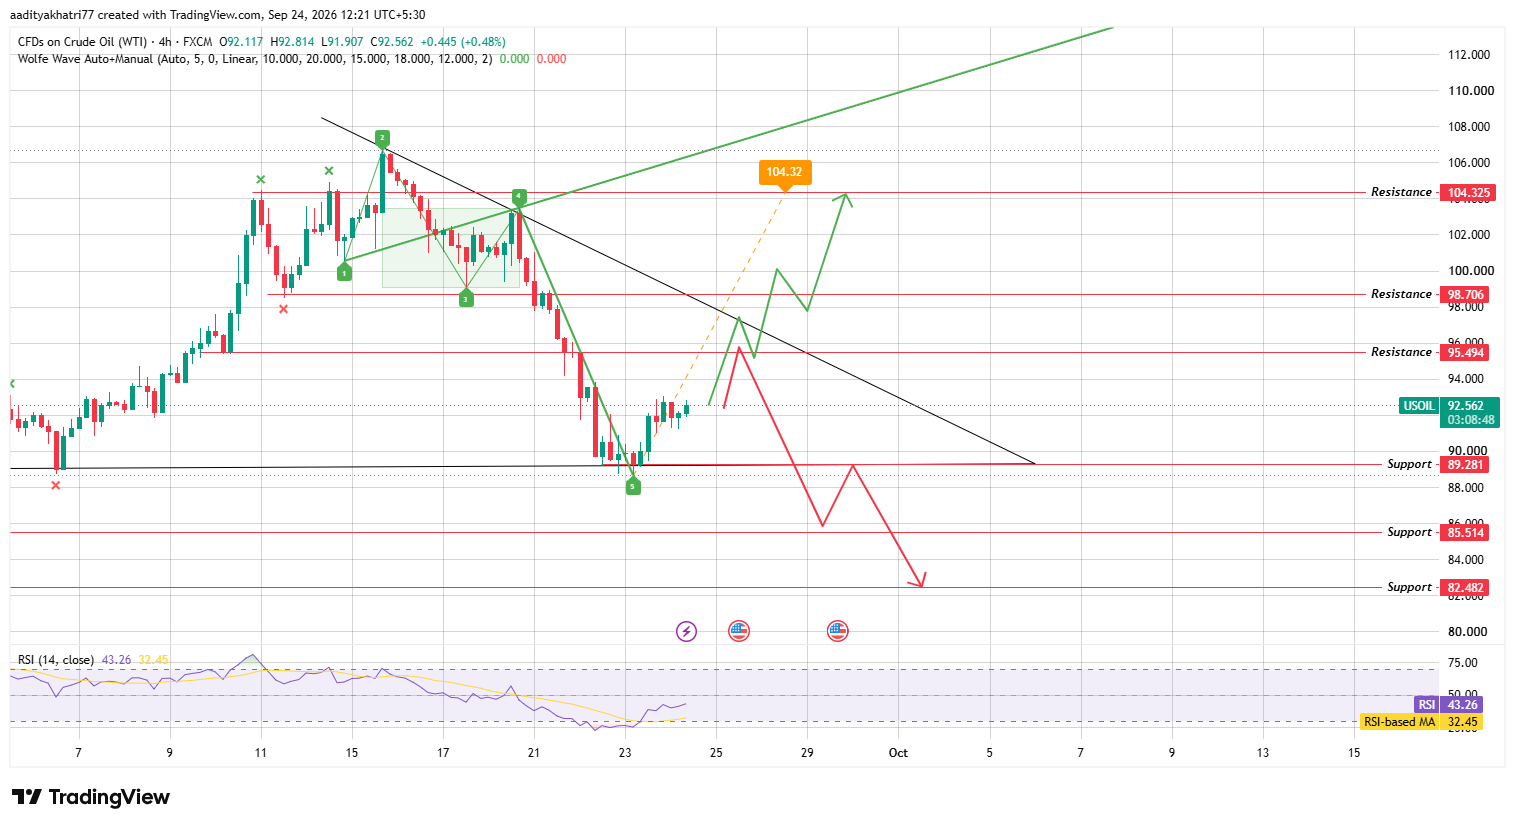
Source: Chart taken from TradingView, as of Sep 24, 2026
WTI trades inside a descending triangle. A falling trendline caps the price from above, while a flat base near $89.281 holds from below.
On September 23, price wicked under that base and recovered, completing a Wolfe Wave with a projected target of $104.32. The RSI reads 43.26, under the 50 midline.
The bullish case starts with a bounce from $89.281. Price must then clear $95.494 (3.2% higher) and close a 4H body above $98.706 (6.6% higher) and the falling trendline.
Volume should be at least 1.5 times the average of the previous 20 candles. That opens $104,325, about 12.7% above the chart price, and keeps the short-term Crude price prediction constructive.
The bearish case begins with rejection near $95.494 or the trendline. A 4H body close below $89.281 would break the triangle floor and open $85.514 (7.6% lower), then $82.482 (10.9% lower).
The price levels to watch:
Disclaimer: This article is for information only and is not financial advice. Volatility and geopolitical headlines can cause sudden price gaps. CFD trading uses leverage and can lead to losses larger than the amount invested. Technical levels can fail, and price can move against every scenario above. The scenarios carry no stated probability. Do your own research and never risk money you cannot afford to lose.





