Solana Price Prediction: Can SOL Trigger a Major Breakout?
A trader going by Inmortal Crypto just told followers "this time, we will go above 300," pointing to a chart with a sharp projected move higher.
The post has traders talking, so it's worth checking what the coin's own chart actually shows right now before getting ahead of that target. Here's the current setup.
Chart Analysis: Fibonacci Levels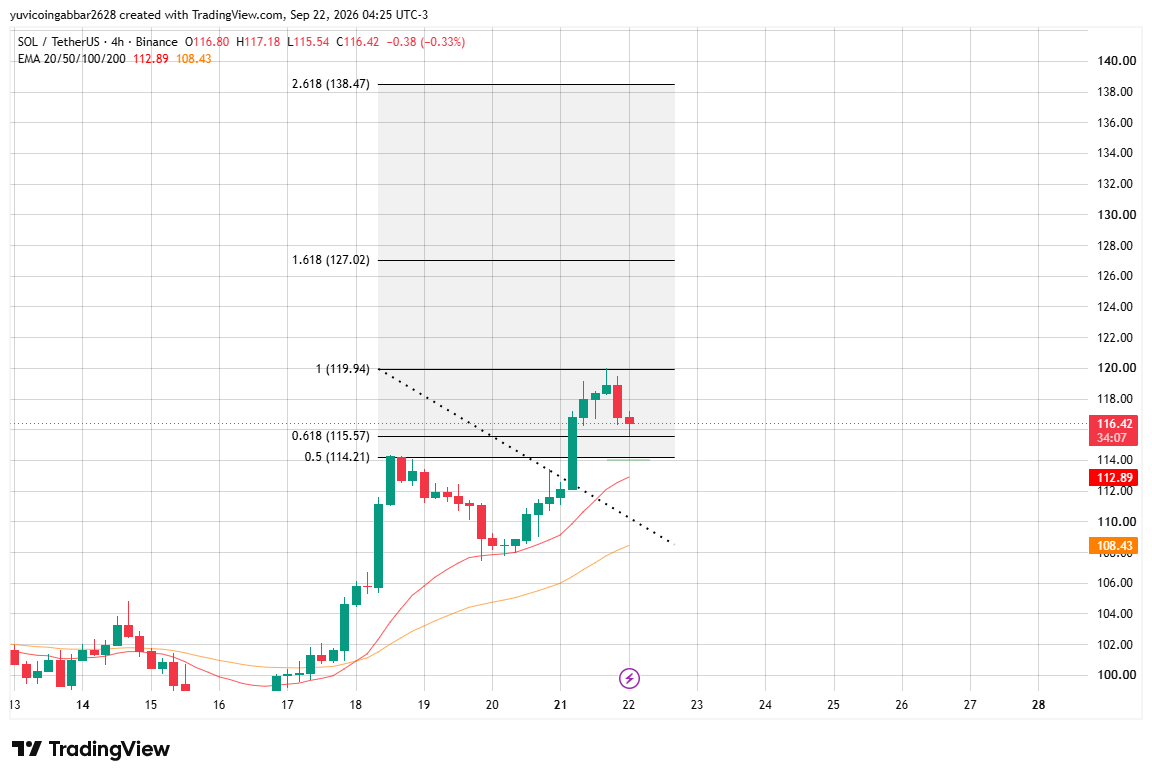
Price recently broke above a descending trendline it had been stuck under for days, rallying hard before pulling back from a high near the 1.0 Fibonacci level at $119.94. It's now consolidating just above the 0.618 retracement at $115.57, sitting right on top of the EMA cluster below.
Bull Case vs Bear Case
Bull case: Holding above $115.57 and clearing $119.94 again opens the path toward $127.02 and eventually $138.47.
Bear case: Losing $114.21 and the EMA cluster below would undo the recent breakout and put the trendline reclaim back in question.
Does the $300 Call Hold Up?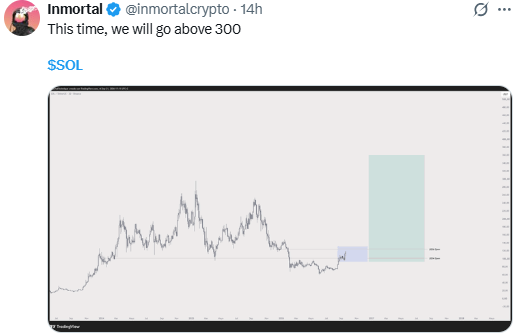
Source: Data From X
The tweet's target sits far beyond every level currently marked on the chart, including the highest Fib extension at $138.47.
Reaching $300 would require clearing that entire zone first, so it's a longer-term call rather than something the current 4H structure supports on its own.
Expert View
The breakout above the trendline is a genuine short-term positive, and the pullback so far looks controlled rather than a reversal. Whether this turns into a larger move depends on holding the $115.57 to $114.21 zone over the next few candles.
Disclaimer
This is for informational purposes only and isn't financial advice. Social media targets like the one referenced here aren't guarantees, and it's worth doing independent research before acting on any price call. Cryptocurrency markets can be highly volatile, and prices may change rapidly due to market conditions, liquidity, news, and investor sentiment. Always consider your risk tolerance and financial situation before making any trading or investment decision.