Solana Price Prediction: IMP Target Levels Before Meeting
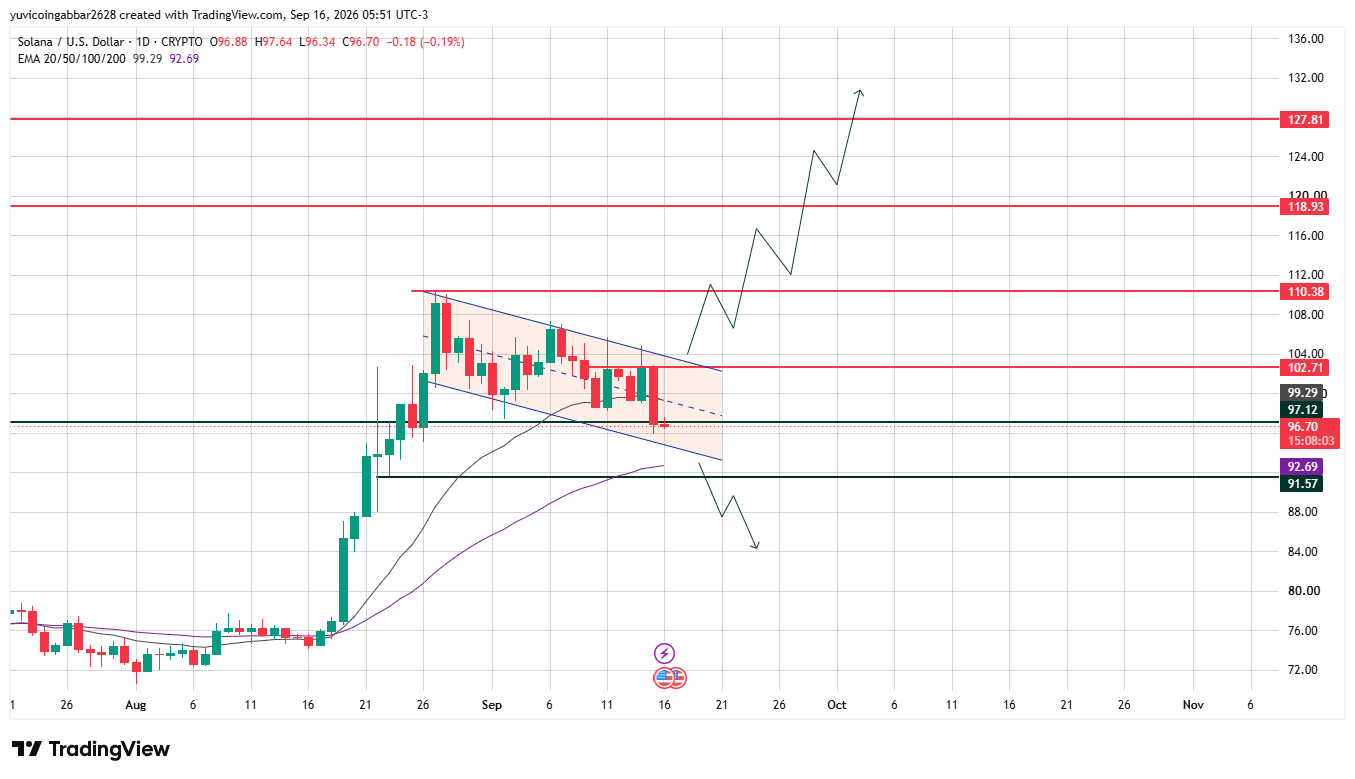
Solana is back on the timeline again, with traders watching the daily chart for the next move. Price slipped further and now sits at $96.70 after breaking down out of its recent wedge.
This Solana Price Prediction covers the breakdown, the support just below, and the key levels ahead. Stick around, the levels below matter more than the headline price.
Solana Price Prediction Today: Market Overview
Source: Data from CoinMarketCap as of September 16, 2026, at 15:21 IST. Figures may vary slightly across other tracking websites.
Chart Analysis
The price broke down out of the sideways wedge it had held since early September, slipping below the $97.12 shelf and the shorter EMA.
It's now trading just above the longer, with that level acting as the last line of support before deeper downside opens up.
Support and Resistance Levels
Bull Case vs Bear Case
Bull case: Reclaiming $97.12 and the shorter EMA near $99.29 would put it back inside the wedge, opening a path toward $102.71 and $110.38.
Bear case: Losing the longer EMA near $92.69 would expose the structural floor at $91.57 and put the broader uptrend in question.
Can It Reach $127.81?
Reaching $127.81 first requires reclaiming $97.12 and $99.29, then clearing $110.38 and $118.93 in sequence, a multi-stage recovery rather than one leg.
Expert View
The break below the wedge and the shorter EMA tilts the near-term picture bearish, with the longer now the key line in the sand.
SOL ETF Flow Snapshot
Source: Data From X
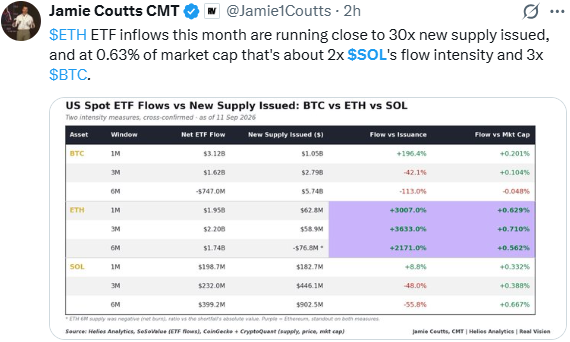
The analyst shared data showing Solana ETF inflows running at about 2x its flow intensity relative to market cap versus Bitcoin this month. It suggests institutional demand hasn't dried up even as price cools.
Disclaimer
This isn't financial advice. These levels come from public chart and market data at the time of writing, and prices can move fast, so do your own research before acting on any of this.