Solana Price Prediction: $SOL Rebound or Breakdown Next?
trading near $102, but one trader on X just laid out a target ladder running all the way to $1,200. That's the kind of number that gets attention fast.
This Solana price prediction checks that ambitious roadmap against what chart is actually showing today.
Solana Price Prediction Today: Market Overview
SOL's $1,200 Target Ladder: Crypto News Today
Trader Don posted a long-term roadmap of $170, then $280, $500, $790, and finally $1,200, built around a multi-year chart pattern. 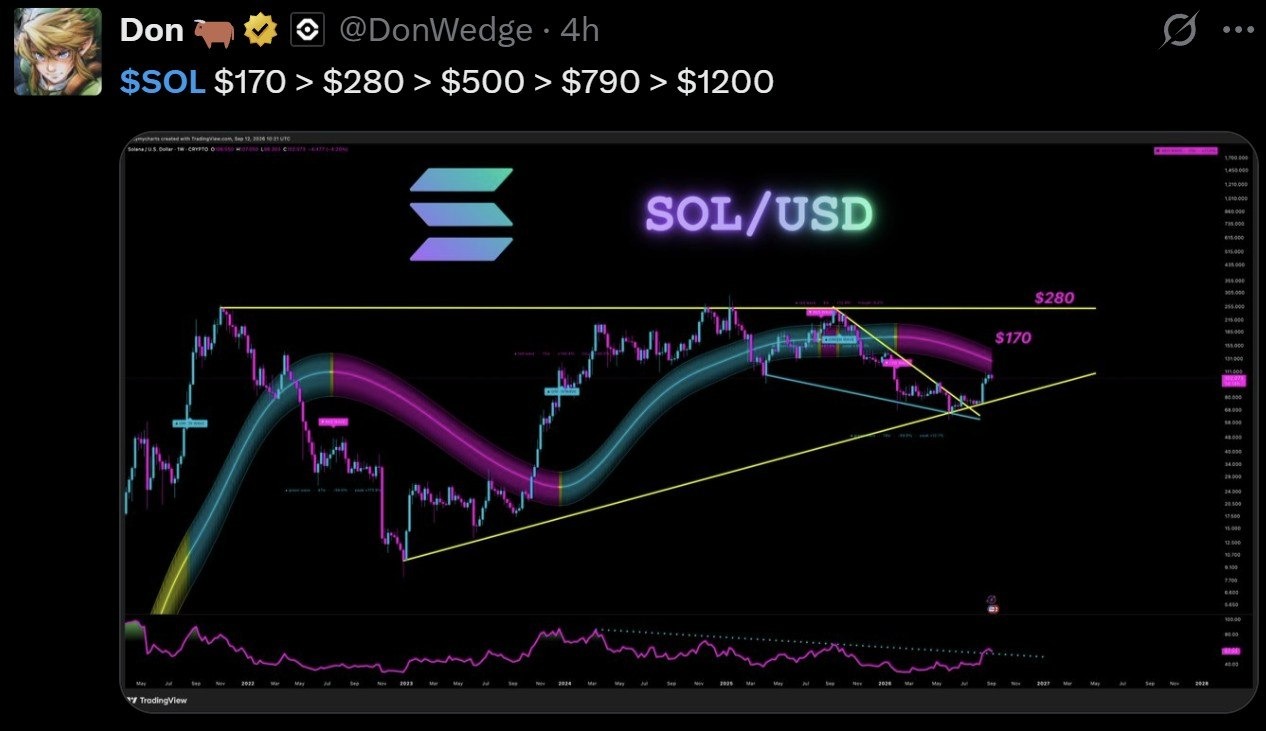
Source: Data From X
It's an aggressive, unverified projection spanning years, not weeks, and could not confirm the timeline behind it.
SOL Price Prediction Chart: Key Levels Today
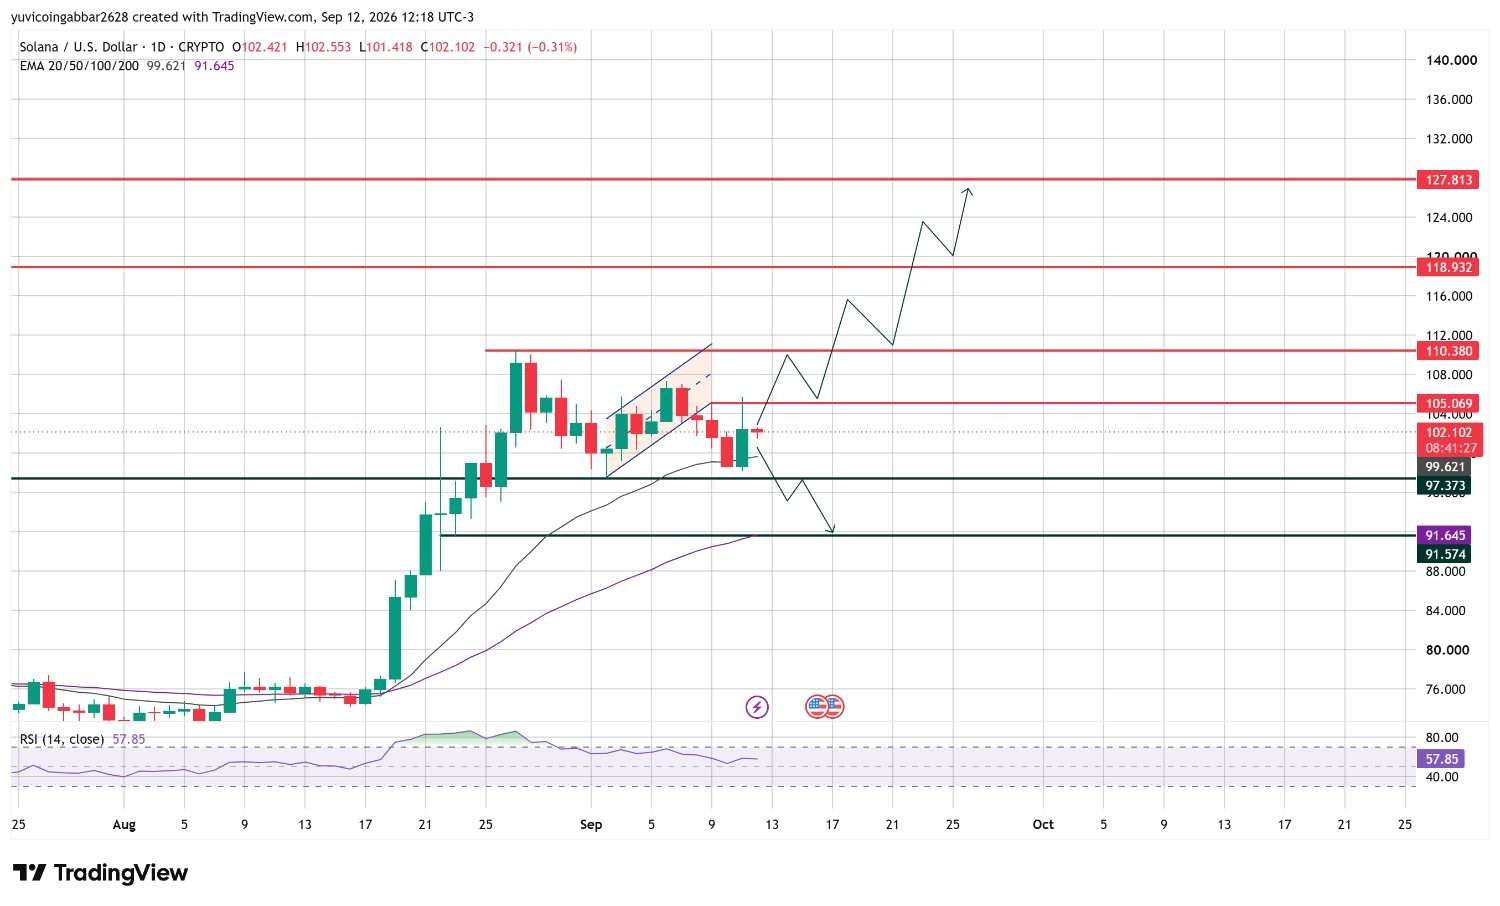
SOL trades at $102.10, down 0.31% on the daily candle, after a sharp late-August rally carried it from roughly $75 to above $110 in just a few weeks.
That move cooled into a rising channel through early September, where price pushed higher inside two parallel trendlines before slipping out of the top of that channel and pulling back toward its current range.
Price is still holding above the shorter EMA near $99.621, with the longer EMA further below at $91.645, both trailing the move upward. RSI has eased back to 57.85 from a stronger reading earlier in the rally, suggesting momentum is cooling without turning bearish yet.
Solana Forecast: Bull Case vs Bear Case
Bull case: Clearing $105.069 opens the door toward $110.380 and $118.932.
Bear case: Losing $99.621 exposes $97.373, with the deeper EMA support at $91.645 as the next real floor if selling picks up.
Expert View
Momentum stays intact above the EMA cluster, but the $1,200 roadmap is a multi-year story, not a near-term signal. The $99.621 to $105.069 zone is what matters this week.
Disclaimer
This piece is for informational purposes only and isn't financial advice. The levels and scenarios above are based on technical chart analysis and publicly available data at the time of writing, and crypto markets can move sharply within hours, so past patterns don't guarantee future outcomes. It's worth doing independent research and considering your own risk tolerance before acting on any of the levels discussed here.