

Is Solana building a base for a bigger move, or is it simply drifting inside a channel?
Solana price prediction 2050 starts with that question, because the structure ahead decides whether long-term bulls get a head start.
Buyers have kept SOL climbing in an orderly pattern since the lows, yet the market has just pulled back from a ceiling.
The next few weekly candles will show whether that pullback is a pause or a warning.
Solana Price Today: Market Cap, Volume, and Supply
SOL was trading near $106.54 per DefiLlama, up 4.19% over 24 hours after moving between roughly $101 and $107. 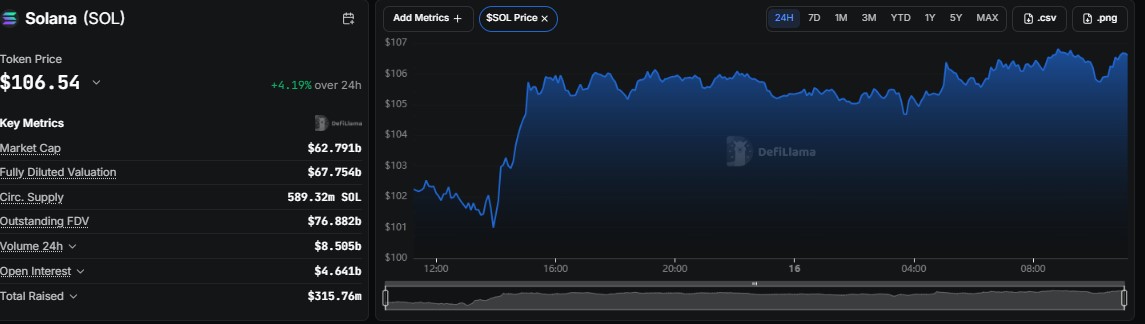 Market cap is about $62.791 billion on 589.32 million circulating SOL, with fully diluted valuation near $67.754 billion and 24h trading volume around $8.505 billion.
Solscan shows a price of $104.80 and a market cap near $66.6 billion because it counts a current supply of about 635.8 million SOL. 
Solscan also lists roughly 1.204 billion holders for the token, a figure that counts accounts rather than unique people.
Data as of 17 October 2026.
What Is the Solana Alpenglow Upgrade?
CoinDesk on X reported that Solana has scheduled the Alpenglow upgrade for October 21. 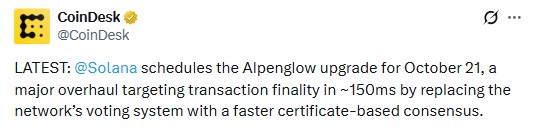
It is billed as a major overhaul of the network's voting system, replacing it with a faster certificate-based consensus aimed at transaction finality in about 150 milliseconds.
Faster finality is a real product upgrade, and it lands just as price tests the lower half of its channel.
Upgrade dates can slip, and "sell the news" reactions are common, so the event adds volatility as much as direction.
Solana Weekly Chart Analysis: Ascending Channel at Support
The weekly chart on TradingView shows a clean ascending channel built since the 62.51 low. 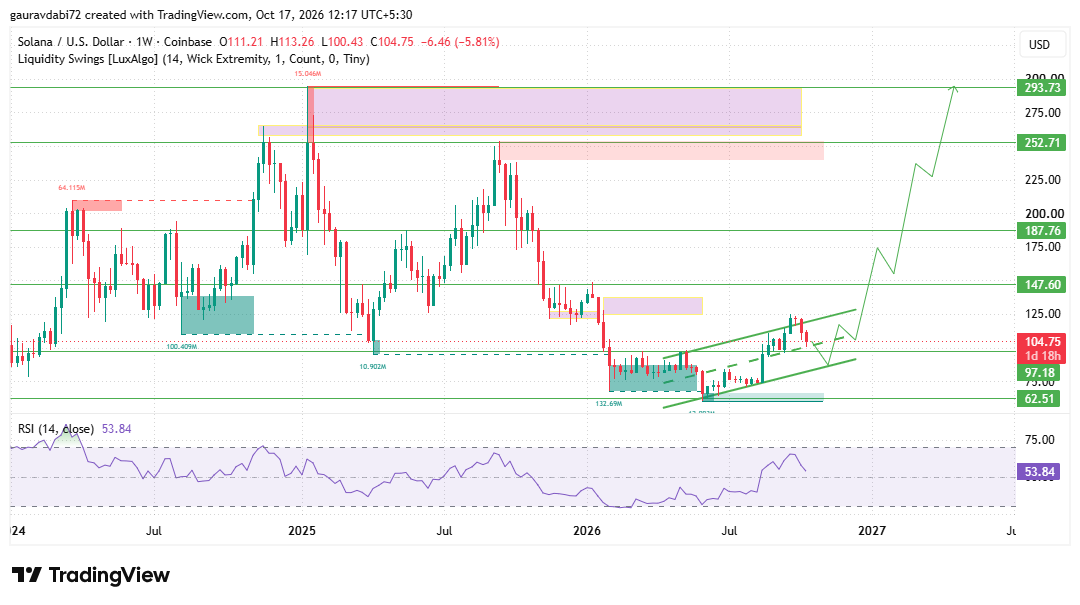
Higher lows have held the lower rail, while the upper boundary in the mid-$120s has acted as resistance, and the latest rejection from that ceiling is what produced this week's candle.
It opened at 111.21, reached 113.26, and has slid to 104.75 after a low of 100.43, a drop of 5.81%.
That puts price in the lower half of the channel, near support. The 97.18 level is the horizontal floor to respect, and it sits close to the lower rail.
As long as buyers defend that area, the channel stays intact and a bounce back toward the upper boundary is the normal expectation.
A decisive weekly close above the boundary would be the real signal, with 147.60 next, followed by 187.76, 252.71, and 293.73 as the higher marked levels.
A weekly close below 97.18 would break the channel and expose 62.51. RSI at 53.84 is neutral, which fits a market waiting for a catalyst.
For an earlier outlook, check out our Solana Price Prediction 2040 and see how SOL’s key levels and market trend have evolved.
Is Solana Open Interest Rising or Fading?
According to Coinglass, SOL open interest is near $6.5 billion. It peaked around $7.6 billion in late August and again in early October, and it was closer to $4.5 billion in early August. 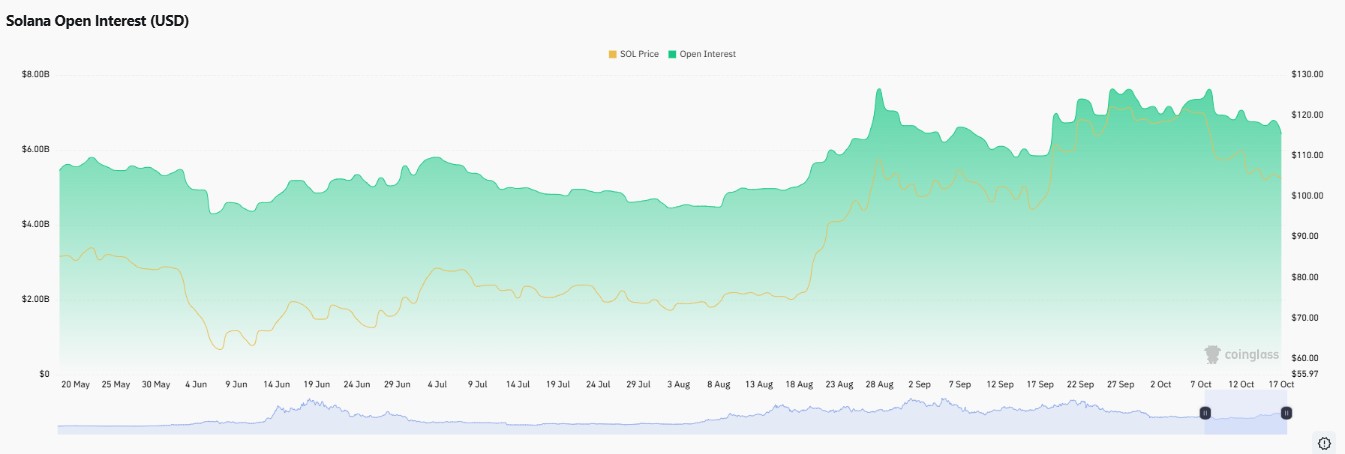
Price rose from the $70s to about $120 across that stretch, so the rally carried real leverage with it.
Open interest has eased as price pulled back, which points to some positions being closed rather than aggressively added.
A channel breakout would be more convincing if open interest rebuilds alongside it.
Can SOL Reach $10,000 by 2050? The Long-Term Solana Forecast
Solana price prediction 2050: the math sets the tone. At the current circulating supply, $10,000 per SOL implies a market cap near $5.9 trillion, about 94 times today's $62.8 billion.
Over 24 years, that needs roughly 21% growth a year.
No weekly chart can prove it, so this Solana forecast keeps the chart-backed levels separate from the long-horizon headline.
Key Risks for Solana
Another rejection at the upper boundary would keep SOL trapped inside the channel.
A weekly close below 97.18 would break the structure and open a path to 62.51.
An Alpenglow delay or a sell-the-news reaction could hit sentiment.
A $10K outcome rests on assumptions over 24 years that cannot be tested today.
Expert Opinion
As per the analyst desk, the ascending channel is the constructive structure, and 97.18 is the line that keeps it alive.
A weekly close above the upper boundary with rising volume would shift the bias firmly bullish, while a close below support would hand control to sellers.
Traders can compare this Solana forecast with shorter-term outlooks to see how the levels fit together.
Conclusion
Solana price prediction 2050 begins with a simple read of the weekly chart: SOL is climbing inside an ascending channel and sitting near support after a rejection at the top.
A hold above 97.18 keeps the path toward 147.60 open, while a breakdown points back to 62.51.
The $10K figure is a long-horizon scenario, and the token ahead is where the real decisions get made.
Disclaimer: This article is for informational and educational purposes only and is not financial advice. Cryptocurrency prices are volatile, and long-term projections are speculative. Always do your own research before making any investment decision.





