
Is Solana lining up for another run, or is the recent pullback the start of something heavier?
After a strong autumn rally, SOL has cooled off while the bigger structure still looks constructive, and long-range traders want to know how far this cycle could stretch.
This Solana Price Prediction 2040 looks at what the chart, derivatives data, and fresh news really support over the long haul.
Solana Price Today: SOL Market Snapshot
Per DefiLlama data, Solana trades at $107.97, up 0.54% over 24 hours. Market capitalization is $63.62 billion with a fully diluted valuation of $68.65 billion, and a 24-hour volume of $8.10 billion shows the token is far from illiquid. 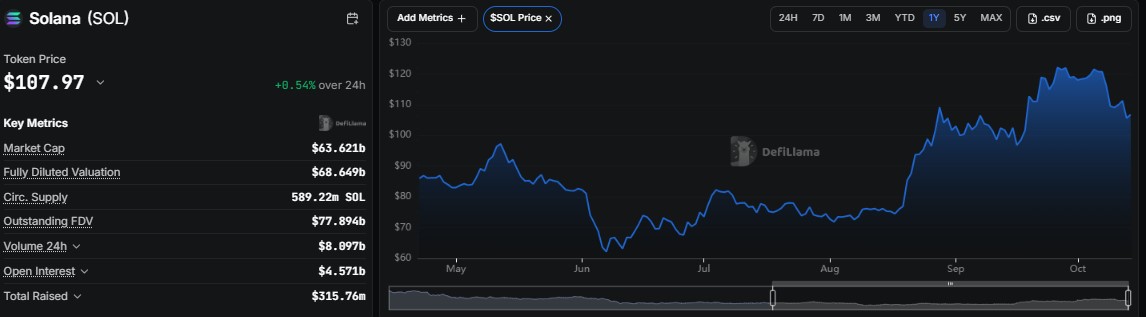
Circulating supply stands at 589.22 million SOL. The one-year view tells the bigger story: SOL bottomed near $62 in June, ground higher through the summer, then jumped from late August and tagged roughly $122 in early October before easing back.
Solana On-Chain Data: Supply and Holder Count
According to Solscan, SOL is priced at $107.5 with a market cap of about $68.34 billion on a current supply of 635.72 million SOL. 
The explorer also lists more than 1.2 billion holders. Solscan and DefiLlama count supply differently, which is why the market cap figures do not match exactly, but both point to a deep and widely held network.
Solana Open Interest: Are Leveraged Traders Staying Put?
Per Coinglass data, open interest topped out near $7.6 billion in late August and again in early October, and it now sits around $6.8 billion. 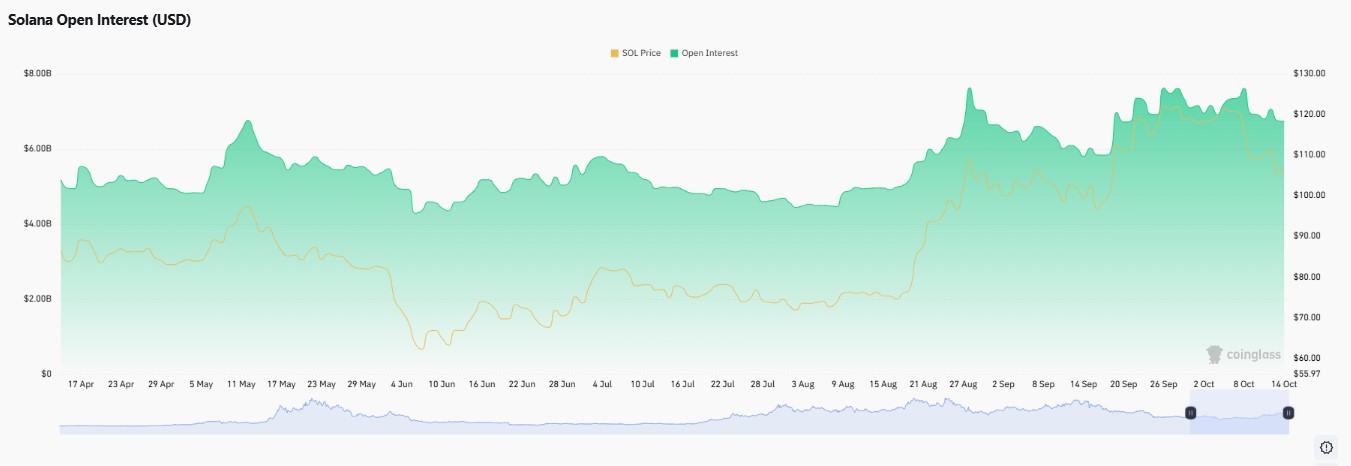
Price has slipped from the $120 area to about $105 over the same stretch, yet open interest has barely moved.
That means leveraged traders are mostly holding positions through the dip, which keeps the market sensitive to a sharp move in either direction.
DefiLlama's own tracker shows $4.57 billion, a different measure.
Solana News: 82 Million Users Teaser and Pando ETF Launch
In a post on X, the official Solana account said the right app at the right time could bring 82 million new users to the network and asked whether the community is ready. It is a teaser, not a product announcement, but it keeps the adoption narrative alive.
A separate post from The Money Ape flags liquidation zones: more than $625 million in longs could be wiped out below $90, while roughly $1.24 billion in shorts could be squeezed above $125. 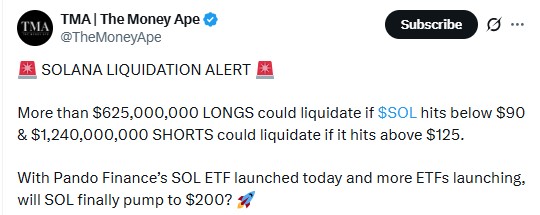
The post also says Pando Finance's SOL ETF launched today with more ETFs on the way.
Treat the liquidation numbers as the account's estimate, but they do map out where the market could accelerate.
Solana Weekly Chart Analysis
Per TradingView chart data, SOL is still trading inside a weekly ascending channel, a structure that has produced higher highs and higher lows through the recovery. 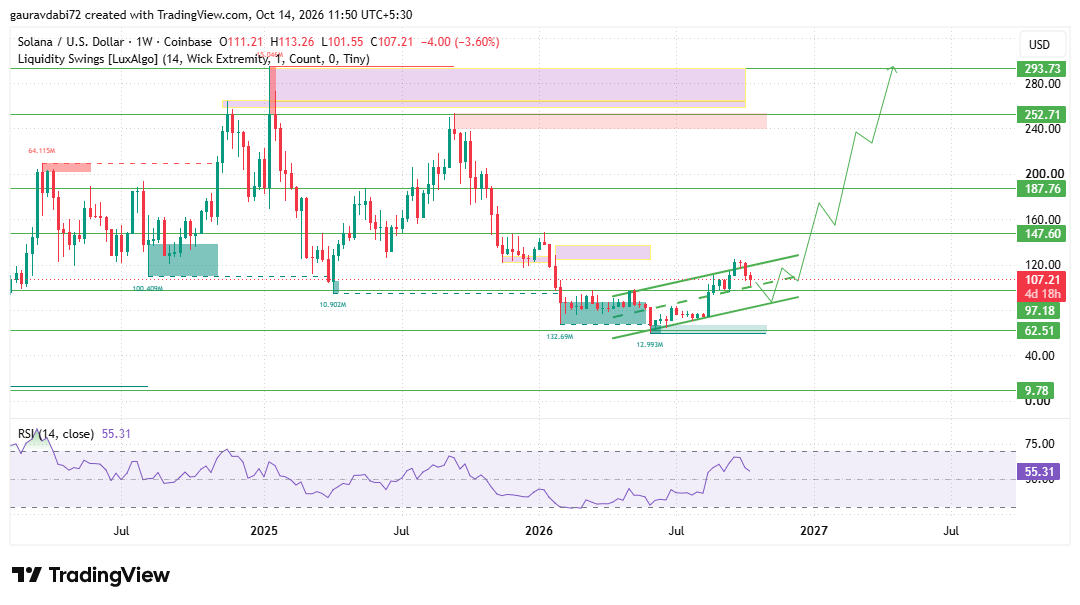
The early-October push toward $122 tested the upper side of that channel, and the pullback to around $108 looks like a normal cooldown inside it.
The nearest support sits at 97.18, close to the $90 level where the liquidation post sees heavy long exposure, and a weekly loss of that area would expose 62.51, the zone that marked the June low.
On the upside, 147.60 is the first resistance that matters, followed by 187.76, 252.71, and 293.73.
Weekly RSI at 55.31 has cooled from its recent push but still holds above the midline, so momentum has eased without turning bearish.
A break below the channel and 97.18 would weaken the structure. As long as the channel floor holds, the larger trend stays constructive.
A break below it would weaken the setup. For an earlier outlook, check out our Solana Price Prediction 2035 and see how SOL’s key levels and market trend have evolved.
Can SOL Hit $2,000 by 2040? Solana Forecast Scenarios
The $2,000 question comes down to arithmetic. At $2,000, Solana would carry a market cap of about $1.18 trillion on today's circulating supply, against $63.62 billion now.
That is roughly an 18.5x move from $107.97. A realistic Solana Price Prediction 2040 therefore depends on whether the network can keep adding users and applications at scale for another 14 years, not only on chart patterns.
The weekly channel supports a recovery toward 147.60 and 187.76 first, and anything past 293.73 would need a new cycle high with sustained demand.
Our Solana forecast scenarios are below.
Key Risks for the Solana Price Prediction 2040
A weekly break under the channel floor and 97.18 would put 62.51 back in play and damage the higher-low structure.
With open interest still near $6.8 billion, a push below $90 could trigger a long liquidation cascade, and a spike above $125 could just as easily force shorts out.
User growth teasers are not the same as delivered adoption, and ETF launches do not guarantee steady inflows.
An 18.5x climb needs capital on a scale few assets have ever pulled in, so every long-range level here is a map, not a promise.
Expert Opinion on the Solana Forecast
As per the analyst desk, Solana is cooling inside a healthy structure, not breaking it.
The desk views $2,000 as the outer edge of the bullish case and sees the 187.76 to 293.73 zone as the more grounded first test.
Holding the channel and reclaiming 147.60 on the weekly chart, ideally with ETF demand building, would be the earliest sign that the Solana forecast base case is taking shape.
Conclusion
Solana has cooled from its early-October high but keeps its weekly ascending channel, deep liquidity, and a growing ETF narrative.
Heavy leverage keeps the downside risk real. The $2,000 idea fits only a very strong bullish scenario, while the nearer path runs through 147.60, 187.76, and 293.73.
Any Solana Price Prediction 2040 should be read in that light.
Disclaimer: This article is for informational and educational purposes only and is not financial advice. Cryptocurrency prices are highly volatile, and long-term forecasts are uncertain. Always do your own analysis before making any trading decision.