Is Solana still early in a much longer climb, or is the latest pullback the first crack in a crowded trade?
The Solana Price Prediction 2035 debate hinges on whether the network can hold its structure and keep compounding for nine more years.
The weekly chart sits at a decision point, and what price does next will shape how credible the long-range case looks.
For an earlier outlook, check out our Solana Price Prediction 2030 and see how SOL’s key levels and market trend have evolved.
Solana (SOL) Price Today: Market Stats Before the 2035 Outlook
Solana trades near $112, up 1.94% over 24 hours, per DefiLlama data. Market cap stands at $66.02 billion with a fully diluted valuation of $71.24 billion, backed by 589.11 million SOL in circulating supply. 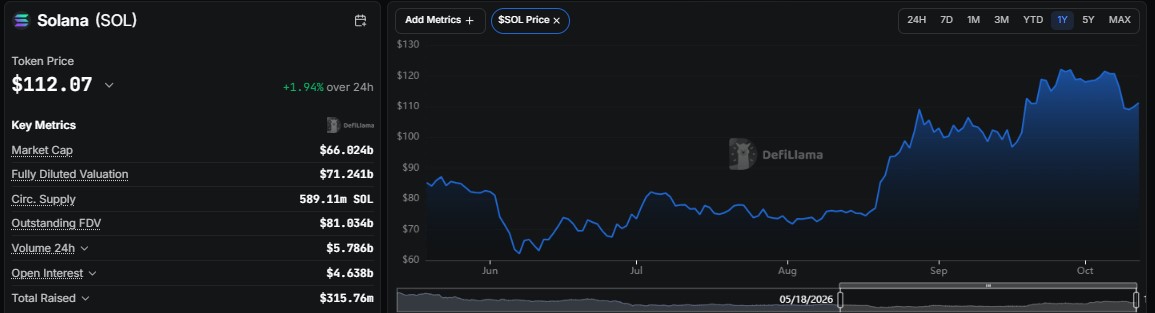
And $5.79 billion in 24-hour trading volume.
 Solscan lists current supply near 635.66 million SOL. The one-year view shows the bigger move: from a June low near $62, the price climbed above $120 by early October before easing back.
Hong Kong Solana ETF and Backpack's Aggregation Thesis
A second spot for the Solana ETF is heading to Hong Kong, according to an X post by Solana. 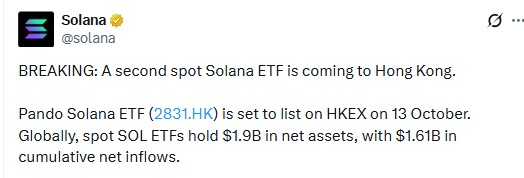
The Pando Solana ETF (2831.HK) lists on HKEX on 13 October, and global spot SOL ETFs now hold $1.9 billion in net assets with $1.61 billion in cumulative net inflows.
Steady Solana ETF inflows matter for any long-range Solana forecast because they add a regulated demand channel.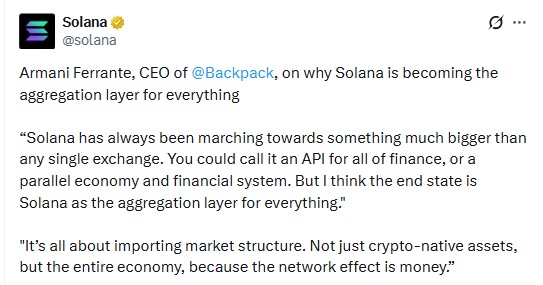
In another Solana X post, Backpack CEO Armani Ferrante argued the network is becoming the aggregation layer for everything, from an API for all of finance to a parallel financial system.
It is narrative rather than data, but it captures the Solana network effect argument long-horizon bulls lean on.
SOL Open Interest: Leverage Rebuilds as Price Cools
Per Coinglass, SOL open interest sits near $7 billion, up from roughly $4.5 billion in early August. 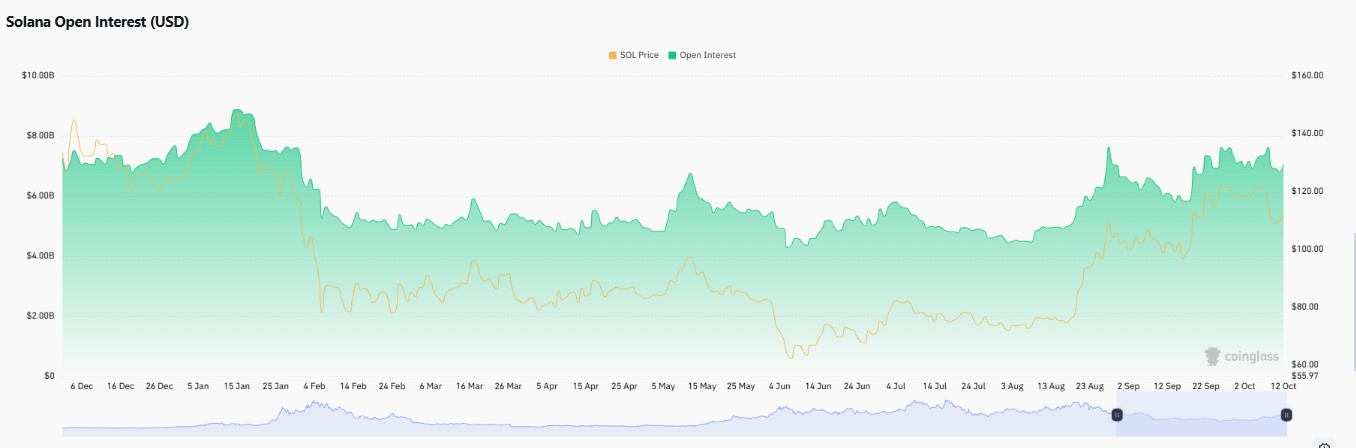
It has held between about $6 billion and $7.7 billion through September and October even as the price slipped from above $120.
Traders are staying engaged, though crowded positioning means a sharp move either way could trigger liquidations.
Solana Weekly Chart: Ascending Channel Presses the Upper Trendline
Per TradingView weekly chart data, price has rebuilt inside a Solana ascending channel since bottoming at $62.51, printing higher lows along the way. 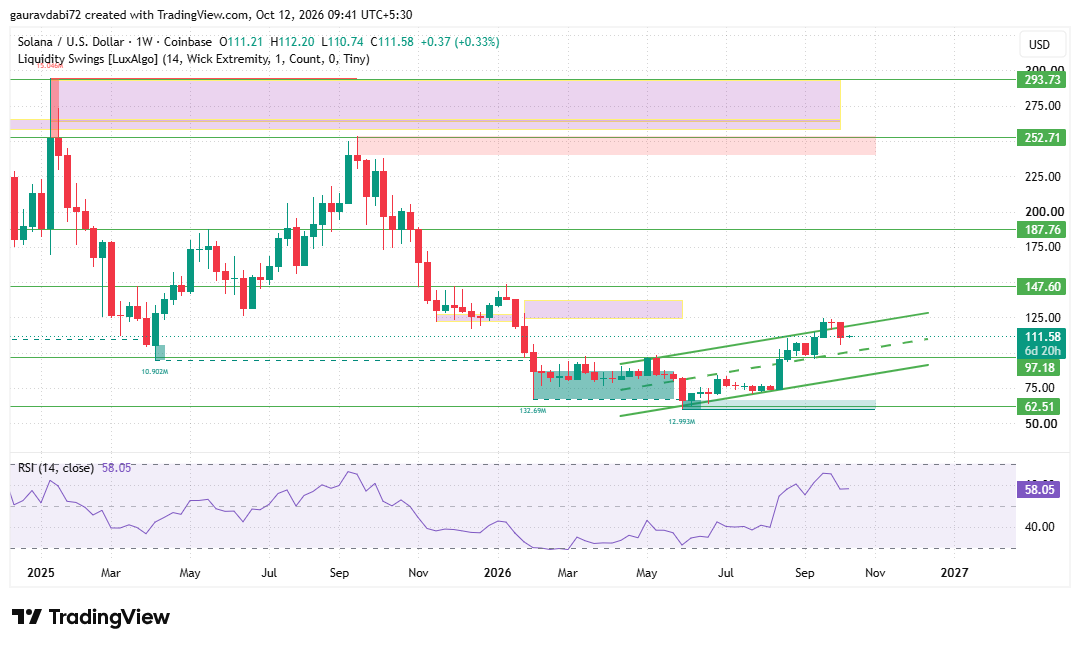
The latest weekly candle reversed from the upper boundary, and the price now trades near $111.58, still hugging that trendline.
A weekly close above the channel would give buyers room to press toward $147.60, with $187.76, $252.71, and $293.73 stacked above as resistance levels.
On the downside, $97.18 is the first support, and a loss there would expose $62.51. The $9.78 level is a deep structural floor that only matters if the broader cycle breaks down. RSI at 58.05 sits in neutral-to-bullish territory.
As long as the higher lows hold, the bias stays constructive, but a breakout still needs confirmation.
Can SOL Reach $1,500? What the Math and the Structure Say
From $112, $1,500 is roughly a 13x move. On today's circulating supply it implies a market cap near $884 billion, against $66 billion now.
That would need sustained adoption, deeper institutional access through spot ETFs, and a clean weekly break above the channel first.
The base case needs the channel to hold and the first resistance cluster to flip into support. The bull case adds sustained ETF demand and fresh network usage.
The bear case starts with a failed breakout and a weekly close back under channel support.
Key Risks for Solana's Long-Range Outlook
A second rejection at the upper trendline would delay the breakout case. Elevated leverage can amplify a pullback, ETF demand can cool if risk appetite fades, and Bitcoin correlation still steers the market.
Over nine years, real adoption has to keep pace with the narrative.
Analyst Desk View on SOL
As per the analyst desk, the structure behind the Solana Price Prediction 2035 case favors patience over prediction.
The channel is intact, momentum is neutral, and news flow is supportive but not yet price-changing.
A confirmed weekly breakout would be the first clean signal that the 2035 case is gaining ground, while a failure to hold support would argue for resetting expectations.
Conclusion
The Solana Price Prediction 2035 outlook starts from a constructive but unconfirmed position.
The weekly structure, ETF expansion, and steady derivatives interest support the bullish case, while the upper trendline remains the immediate hurdle.
Until the price breaks higher with conviction, the forecast stays conditional, and $1,500 remains a stretch scenario rather than a base case.
Disclaimer: This article is for informational and educational purposes only and is not financial advice. Cryptocurrency prices are highly volatile, and long-term price predictions are speculative. Always assess your own risk before investing.