Is Shiba Inu finally gearing up to leave its long downtrend behind? After more than a year of lower highs, the meme coin has been squeezing into an ever tighter range, and buyers have started to show up near the lows.
That shift is why the Shiba Inu price prediction 2027 debate has picked up again among traders.
The big question is whether SHIB can turn this slow recovery into a real trend change, or whether the squeeze simply resolves lower.
Shiba Inu Price Today: Market Cap, Supply and Volume
SHIB is trading near $0.000005825, up 0.92% on the day, according to Coinglass. 
Coinglass lists total supply at 589.49 trillion and max supply at 589.55 trillion, so virtually the whole supply is already in the market.
That matters because it removes the unlock overhang that weighs on many other tokens.
Activity also leans toward derivatives, with 24-hour futures volume at $47.31 million against $20.60 million in spot.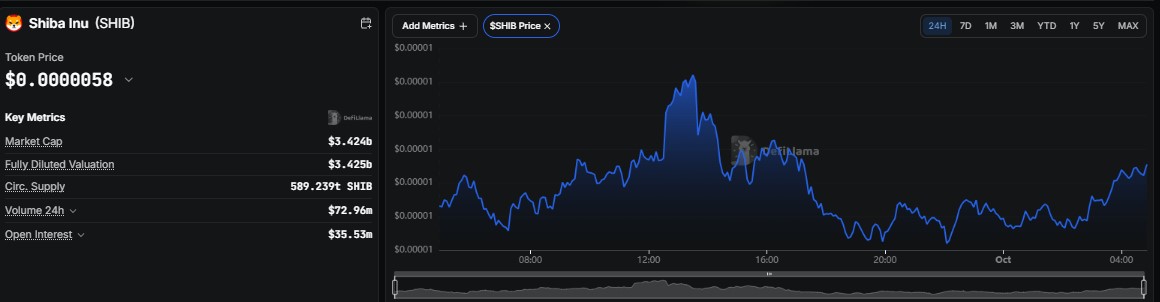
Market capitalization sits at about $3.42 billion, and per DefiLlama data, the fully diluted valuation is almost identical at $3.425 billion, with 589.239 trillion SHIB circulating.
How Has Shiba Inu Performed Through 2026?
Per Coinglass, SHIB is down 15.61% year to date and 50.72% over one year, so the broader picture is still red.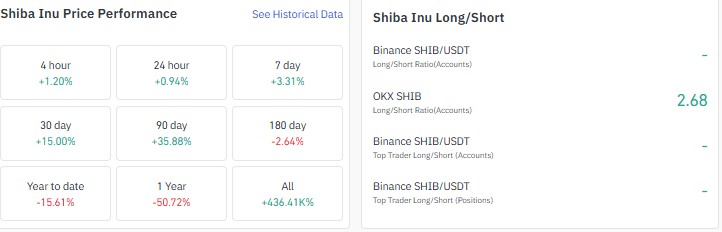
The recent trend points the other way. The token is up 15.00% over 30 days and 35.88% over 90 days, while the 180-day reading still shows a 2.64% loss.
Put together, the damage ran into early summer and the repair began after. Shorter windows are positive too, with a 3.31% gain over seven days and 0.94% over 24 hours.
In plain terms, SHIB spent the first half of the year bleeding and has been rebuilding since.
Shiba Inu Long-Short Ratio and Liquidations:
The OKX long-short account ratio for SHIB reads 2.68, so longs outnumber shorts by a wide margin on that exchange, per Coinglass.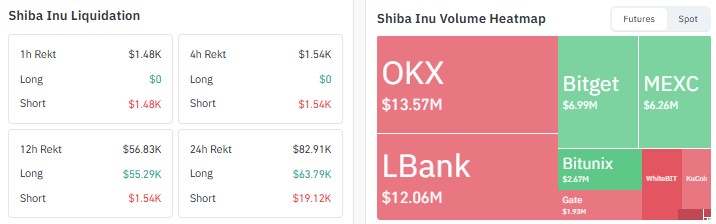
Liquidations have been small. Over 24 hours, about $82.91K was wiped out, split between $63.79K in longs and $19.12K in shorts.
Most of the long damage landed between roughly four and twelve hours ago, since the 12-hour figure shows $55.29K in long liquidations while the 4-hour reading shows none.
The latest hours have only flushed about $1.5K of shorts. So the earlier dip shook out longs, and the recent push has squeezed a few shorts.
Crowded long positioning is a risk if a breakout attempt fails, though the amounts are too small to call it stress.
Shiba Inu Open Interest: Is Leverage Rebuilding Under the Wedge?
Open interest stands at $65.70 million, according to Coinglass. Its chart shows a peak of $145.13 million in early January, a long slide through spring and summer to roughly $25 to $30 million around late June and July, and a rebuild into the $60 million zone since.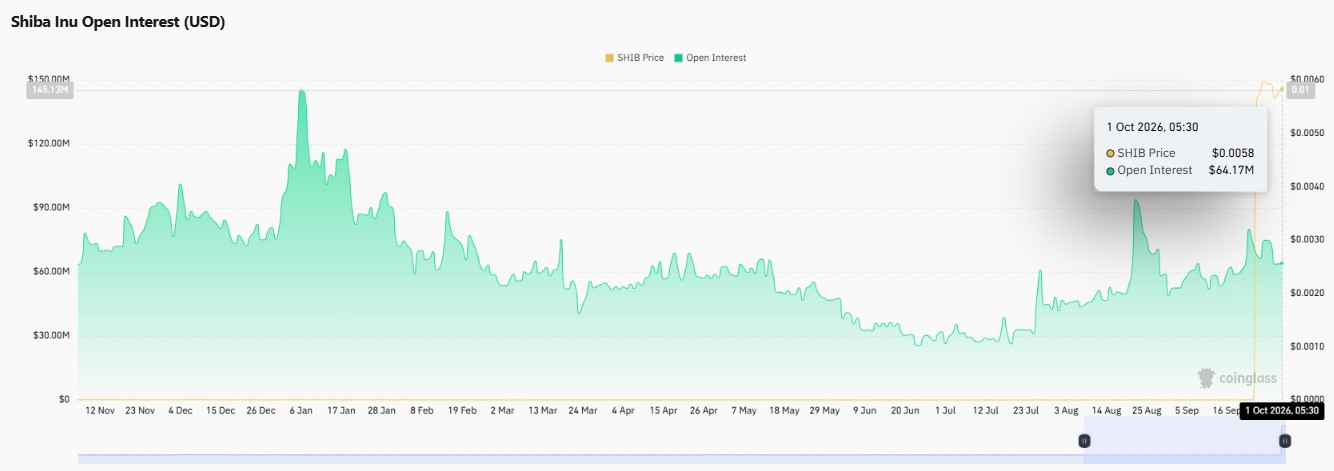
That rebound lines up with the price recovering off the lows, which suggests participation is returning rather than leaving.
With futures volume running at more than twice spot volume, derivatives traders are clearly leading the action.
Rising open interest together with a push above the upper line would strengthen a breakout, while rising open interest with price stalling would hint at a crowded trade.
SHIB Weekly Chart Analysis: Price Tests the Wedge's Upper Boundary
Per TradingView weekly chart data on the Coinbase pair, SHIB has been grinding lower inside a falling wedge, with a falling trendline capping every bounce since early 2025 and the lower boundary catching each dip.
In recent weeks the candles have lifted off that lower boundary, and the price now trades right beneath the upper line, even after the latest weekly candle gave back 1.52% from a high of $0.00000599.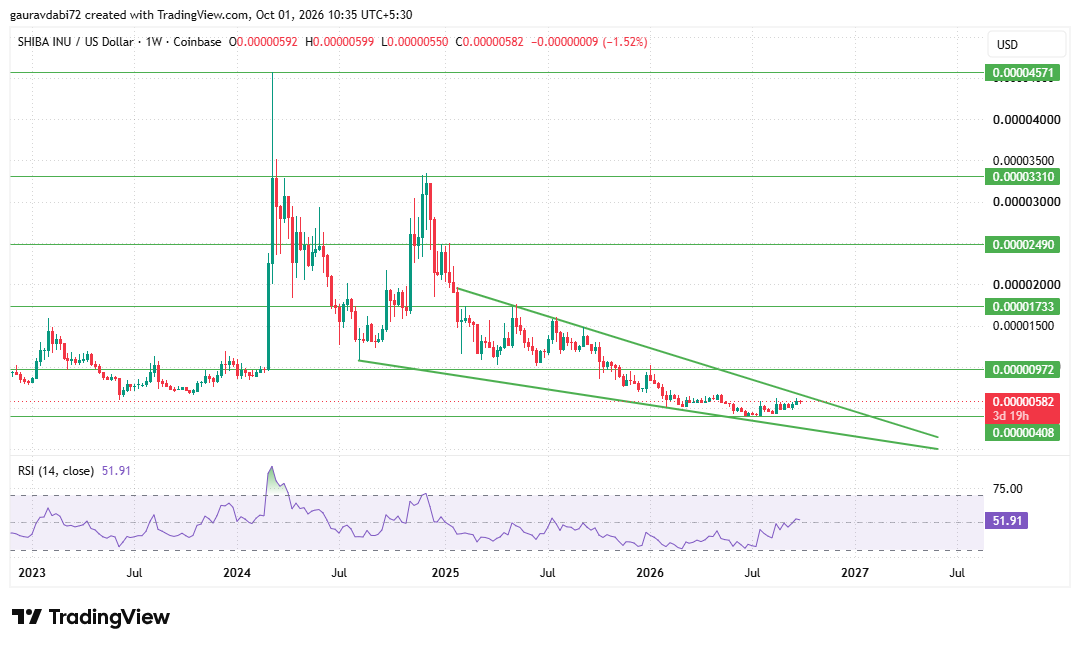
RSI at 51.91 has climbed back above the midpoint after weak readings through most of 2026, so momentum has quietly turned.
The support and resistance levels match the monthly map.
The $0.00000408 area is the demand zone buyers need to defend, roughly 30% below current price, and a weekly close beneath it would put the whole structure at risk.
On the upside, a weekly close above the upper line, backed by clear volume, would bring the first supply zone at $0.00000972 into play, about 67% higher.
Above it sit $0.00001733, $0.00002490, $0.00003310 and $0.00004571, levels tied to the 2024 spike and the late-2024 high.
Shiba Inu Monthly Outlook: Is the Big Wedge Close to Resolving?
The monthly chart shows the same wedge on a bigger canvas, with the upper line sloping down from the early-2025 swing and price pressing against it.
Monthly RSI at 42.29 sits below the midpoint but is turning up, which fits a market that is repairing rather than rallying. 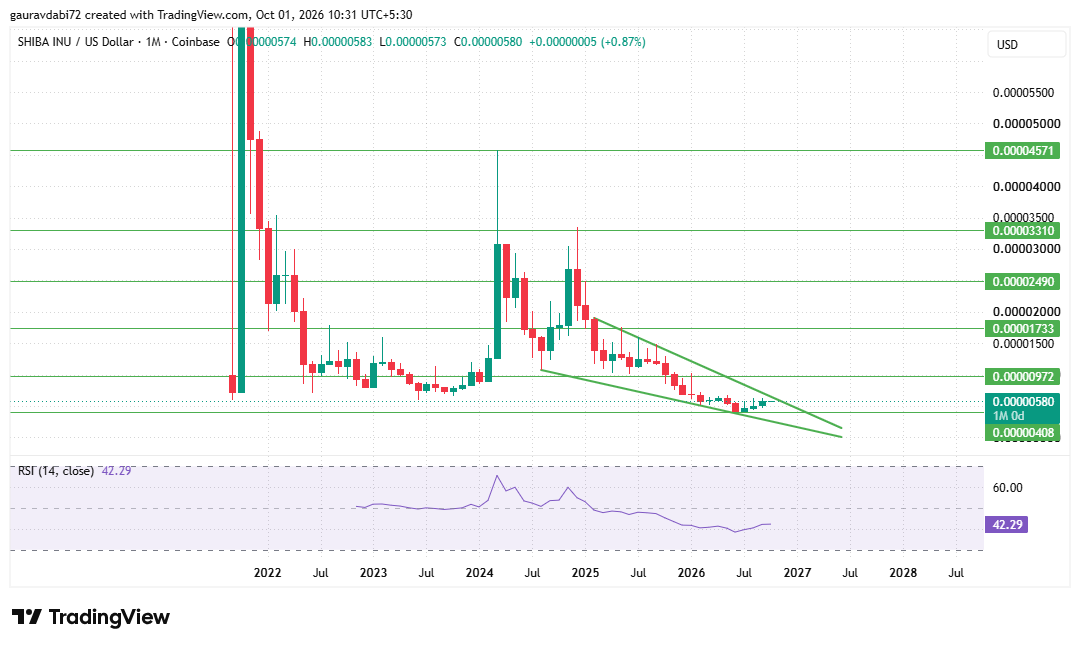
A monthly close above the upper line that holds into the next candle would start to build a bullish structure and open the same ladder, from $0.00000972 through $0.00001733, $0.00002490, $0.00003310, and $0.00004571.
If buyers keep control beyond that, the extended zones at $0.00006679 and $0.00008964 come into view.
That last stretch is a long-range scenario, roughly 15 times the current price, and it would need sustained buying through every level above. Until a close confirms it, the wedge remains a setup, not a signal.
What Needs to Change for SHIB to Climb Back Toward Higher Levels?
A weekly close above the upper trendline comes first, followed by a hold on the retest instead of a quick slide back inside the wedge.
Reclaiming $0.00000972 would be the first real proof of strength.
Open interest should keep rising alongside spot volume, since futures volume is currently more than double spot, and a breakout carried only by leverage tends to be fragile.
A cooling of long crowding would also help, because a 2.68 ratio on OKX leaves room for a flush.
Finally, the monthly candle has to hold, because a weekly pop that fades back into the wedge would repeat the failed bounces of the past year.
Shiba Inu Price Prediction 2027: Base, Bull, and Bear Scenarios
The SHIB price forecast for 2027 splits into four conditional paths, each tied to how the wedge resolves.
Key Risks Facing Shiba Inu in 2027
The first risk is structural. A weekly close below $0.00000408 would break the wedge to the downside and invite fresh lows.
Positioning is the second concern, since long-heavy accounts on OKX and derivatives volume well above spot make the market sensitive to a failed breakout. Third, size matters.
At the current circulating supply, a move to $0.00004571 would imply a market cap near $27 billion, which demands heavy and sustained inflows.
The last is history. A token that is still down 50.72% over one year has seen several bounces fade at the same upper line.
Expert Opinion: Analyst Desk View on SHIB
As per the analyst desk, the weekly and monthly wedges point to the same decision, and the recovery in price, momentum, and open interest since the summer lows is the strongest argument for the bulls.
Compression this tight tends to end in a larger move, and the near-complete circulating supply means a breakout would not face unlock pressure.
The desk still wants a confirmed close above the upper line before leaning bullish, with $0.00000972 as the first proof of strength and $0.00000408 as the line that cannot give way. Until then, patience matters more than prediction. Shiba Inu price prediction 2027
Conclusion
Shiba Inu enters 2027 at a decision point after a year of heavy losses and a clear summer recovery.
Both timeframes show a wedge nearing its end, momentum has turned up, and leverage is rebuilding.
A confirmed breakout and hold above the upper trendline could open the path toward $0.00000972 and the levels above it, while a loss of $0.00000408 would flip the bias lower.
Until then, caution is advised, and confirmation matters more than speculation. Shiba Inu price prediction 2027
Disclaimer: This article is for informational and educational purposes only and does not constitute financial, investment, or trading advice. Cryptocurrency prices are highly volatile, and all price levels and scenarios discussed are conditional views, not guarantees. Readers should assess their own risk tolerance before making any decision.