

SHIB is up 34.86% in 90 days—but down 5.16% today. Is this the breakout before the rally or a trap?
The Shiba Inu Price Prediction 2026 conversation is heating up as the weekly chart compresses against the top of a long channel while neutral momentum leaves both directions open.
Holder data adds another twist, and the next decisive move could arrive sooner than most traders expect.
SHIB Price Today: Where Does Shiba Inu Stand Right Now?
According to Coinglass data, the 1000SHIB contract trades near $0.005648, down about 5.16% on the day, which works out to roughly $0.00000565 per SHIB. Any Shiba Inu price prediction today starts with a market capitalization near $3.33 billion and a circulating supply of about 589.23 trillion SHIB against a 589.55 trillion maximum, so almost the entire supply is already in the market.
How Has Shiba Inu Performed Across Timeframes?
SHIB is down about 6.38% over the past week, though it remains up 10.15% over 30 days and 34.86% over 90 days.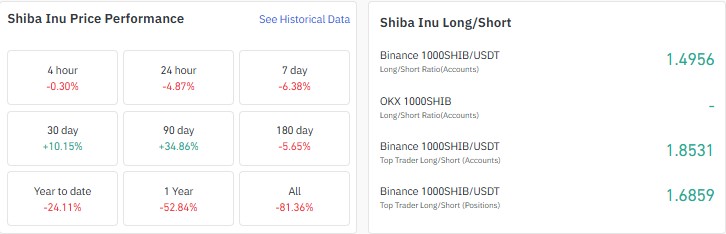
Longer views stay weak, with a 5.65% decline over 180 days, 24.11% year to date, and 52.84% over the past year. The long-short ratio favors longs, with Binance's 1000SHIB/USDT reading near 1.50 and its top-trader accounts near 1.85.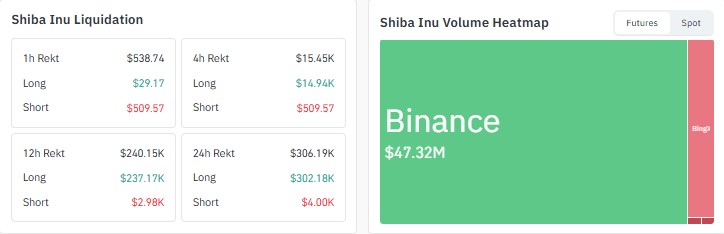
Coinglass data shows about $306,190 in liquidations over the past 24 hours, with roughly $302,180 coming from longs.
What Does Shiba Inu Open Interest Tell Traders?
Open interest stands near $33.47 million, according to Coinglass, well below the spike above $50 million seen in late July but still inside the $20 million to $40 million range that has held for most of the year.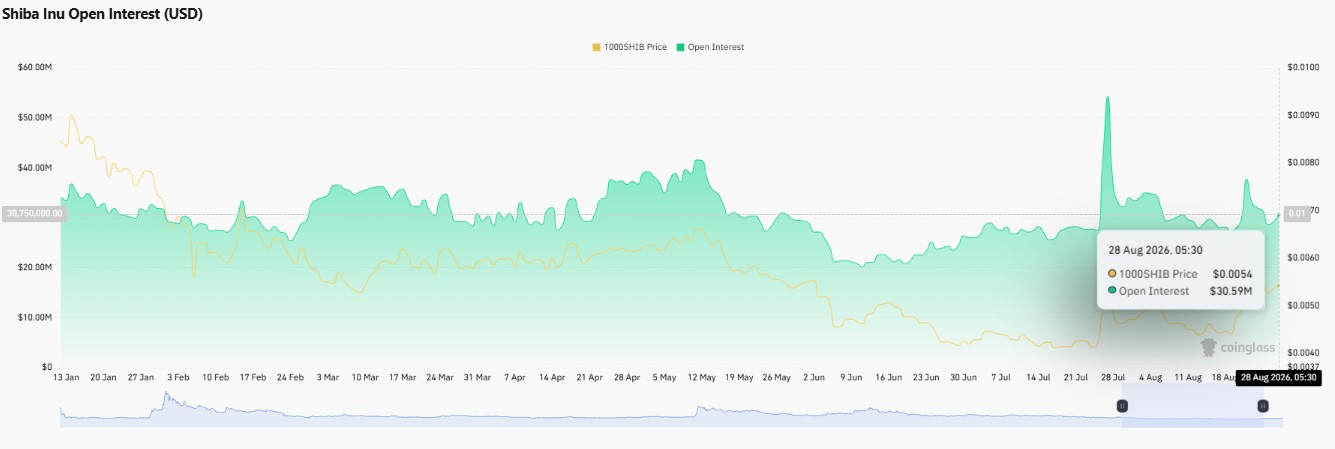
Futures activity is concentrated on a single major exchange, so leverage remains thin and sudden moves can look bigger than the underlying demand.
How Concentrated Is Token Ownership?
Etherscan's holder analytics show the top 100 wallets control 82.83% of supply, with the top five holding 57.90% and seven wallets owning at least 1% each.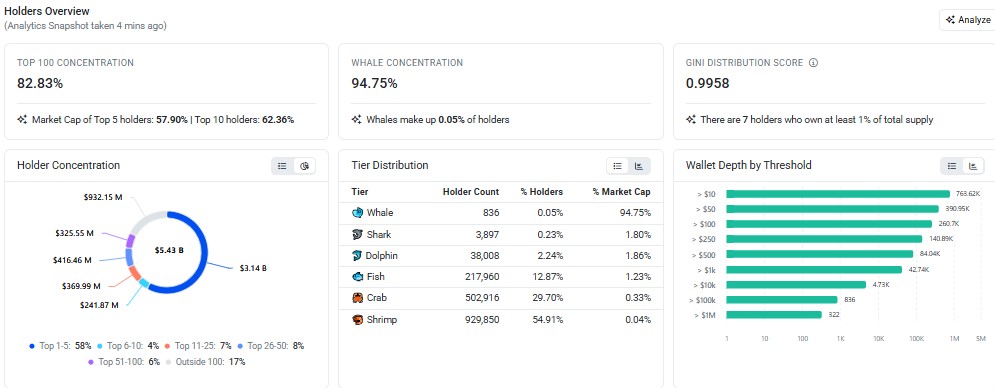
Whales, just 836 wallets or 0.05% of holders, account for 94.75% of market cap. while the Gini score sits at 0.9958.
The data does not reveal who those wallets are, but such concentration means whale activity can move the price sharply.
Shiba Inu Weekly Chart: What Is TradingView Showing?
According to the weekly chart, SHIB has printed lower highs and lower lows since its 2024 peak inside a descending channel.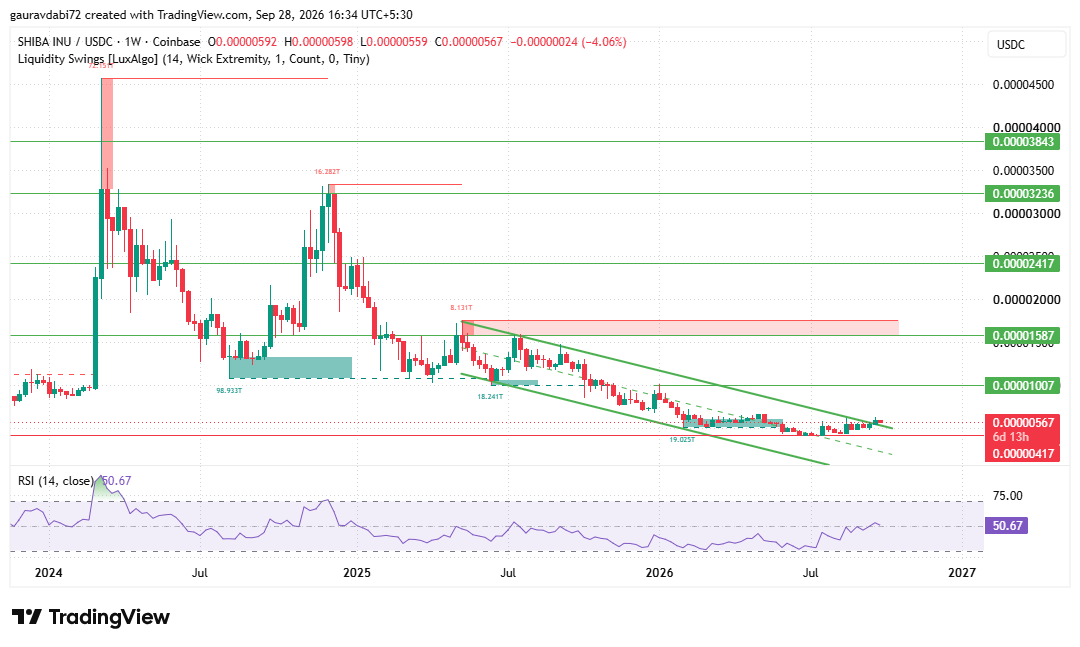
Price now presses the upper boundary after weeks of compression, though a confirmed break with volume confirmation is still missing.
This weekly chart analysis shows RSI at 50.67, right on the midline.
Key resistance sits at $0.00001007, $0.00001587, $0.00002417, $0.00003236, and $0.00003843, with a supply zone between $0.0000150 and $0.0000180.
On the downside, the key level to watch is $0.00000417.
What Could Coin Price Do Next?
Anyone asking will Shiba Inu reach $0.00001 first needs a confirmed break above the upper trendline.
A break above $0.00001007 would open the path toward $0.00001587.
Here's exactly what triggers each scenario.
What Are the Key Risks to Watch?
The long-term structure is still bearish, with no higher low confirmed and weak volume overall. Extreme holder concentration means a few large wallets could shift sentiment quickly.
A weekly close under $0.00000417, a make-or-break level, would put the $0.00000400 to $0.00000350 zone in play.
Expert Opinion: What Does the Analyst Desk Think?
As per the analyst desk, the Shiba Inu price prediction 2026 outlook stays cautious.
Compression and neutral RSI make a breakout or breakdown equally possible, but the bias remains bearish until price breaks the channel and holds above $0.00001.
Conclusion
The token is coiling near the top of a long descending structure with neutral momentum and highly concentrated ownership.
Whether this Shiba Inu Price Prediction for 2026 extends toward $0.00002 and whether is Shiba Inu a good investment in 2026 earns a yes for any given trader depends on a confirmed breakout with volume.
Disclaimer: This article is for informational purposes only and should not be treated as financial or investment advice. Cryptocurrency markets are highly volatile, and readers should conduct their own research before making any investment decisions.





