
Can a coin that fell almost 97% from its peak still stage a comeback? PI has spent months going nowhere, and that stillness is exactly why the Pi Network Price Prediction 2028 question keeps coming up.
The token is resting near a base after a brutal downtrend, but nothing has been confirmed yet.
A few weekly levels and a heavy supply schedule will decide whether this quiet phase turns into a recovery or another leg lower.
Pi Network Price Today: Market Cap, FDV and Supply
Pi is trading near $0.08841, down 2.26% over 24 hours, with a 24-hour range of $0.08614 to $0.09109, according to CoinMarketCap. 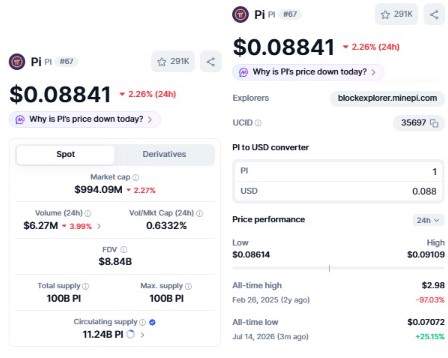
Market cap is $994.09 million, and 24-hour volume is just $6.27 million.
The all-time high of $2.98 came on 26 February 2025, so the token sits about 97% below it, while the all-time low of $0.07072 on 14 July 2026 is roughly 25% under current levels. 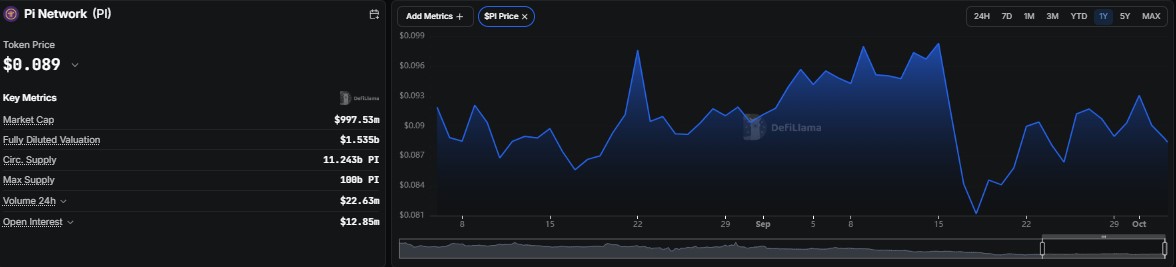
Per DefiLlama, circulating supply is 11.243 billion PI against a 100 billion maximum, and its one-year price chart shows PI moving mostly between $0.081 and $0.099 over the past two months.
FDV is a point of confusion. CoinMarketCap shows $8.84 billion on the full 100 billion supply, while DefiLlama lists $1.535 billion, so the figure depends on how supply is counted.
Is Pi Network Open Interest Too Small to Move the Price?
DefiLlama lists open interest at $12.85 million, barely 1.3% of the market cap. Derivatives are a minor force here, so leverage is unlikely to drive the next big move. Thin spot volume matters more.
When liquidity is shallow, even modest buying or selling can swing price, which cuts both ways for any breakout.
What Does Pi Network Mainnet Supply Data Reveal?
The Pi mainnet explorer shows 11.243 billion PI of migrated mining rewards, of which 6.109 billion is still locked and 5.134 billion is unlocked. 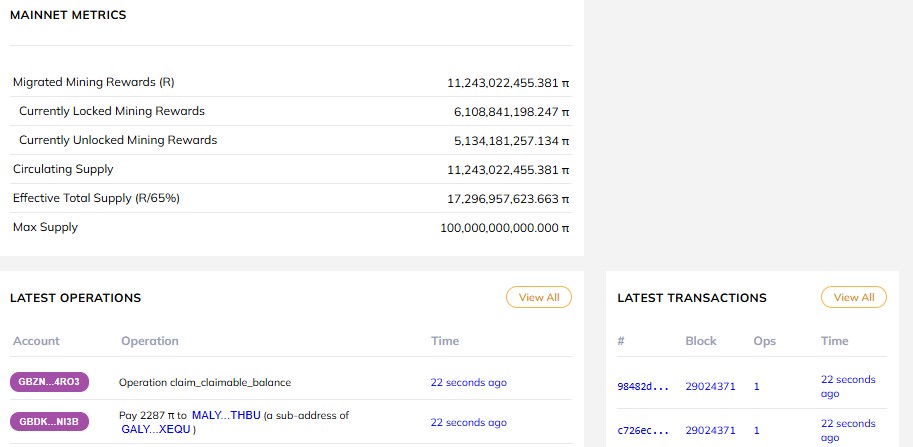
Roughly 54% of migrated rewards remain locked, and the explorer lists an effective total supply of 17.297 billion against the 100 billion maximum.
This Pi Network mainnet structure is the heart of the long-term story. Every unlock adds potential sell pressure, so demand has to grow at least as fast as the freed supply.
The explorer also shows live operations and transactions on the network, so on-chain activity is continuing.
Pi Network News: Developer Tools Quietly Expand
A recent X post by Pi News says local storage is now available for selected Pi Browser apps, developers can access app-specific staking data from the Ecosystem Directory, file and video sharing has been added, and new developer documentation has been released. 
These are building blocks for the Pi Network developer ecosystem.
They do not move price on their own, but they address the biggest gap in the Pi Network long-term outlook, which is real utility beyond mining.
PI/USD Weekly Chart Analysis: Base Forming Above 0.067604
On the PI/USD weekly chart from TradingView, the token slid for well over a year before flattening out. 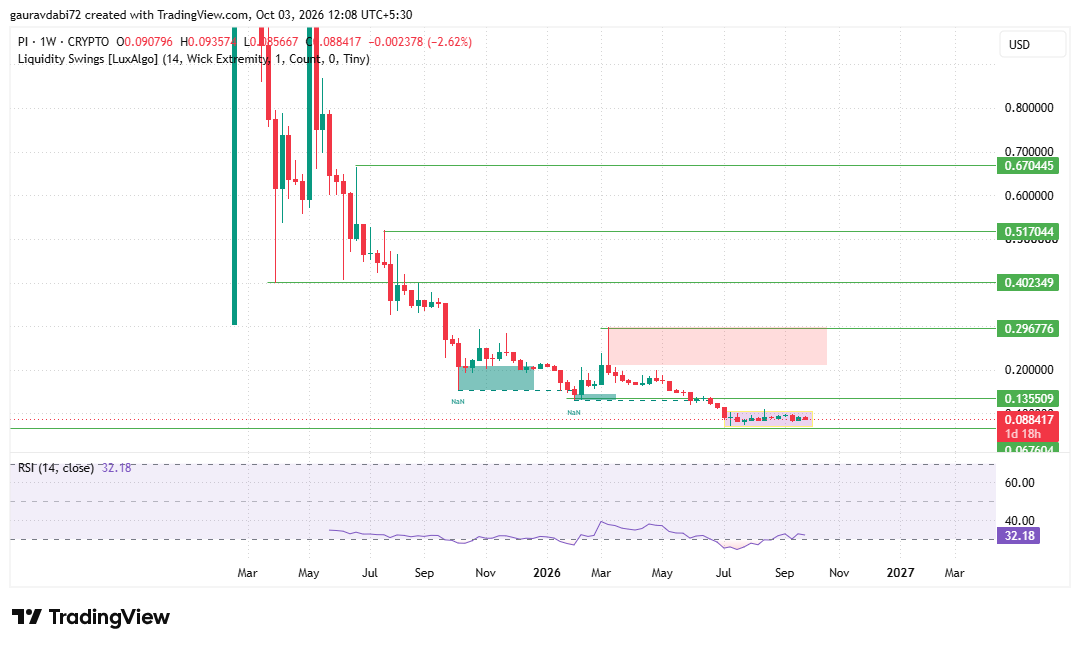
Since July, the price has been compressing in a tight box just above 0.067604, and the latest weekly candle closed near 0.088417 after a 2.62% dip.
RSI reads 32.18, close to oversold, which tells us selling pressure has cooled but buyers have not taken control.
For PI support and resistance, 0.067604 is the line that matters on the downside.
Losing it on a weekly close would open fresh lows with no mapped support below.
On the upside, 0.135509 is the first resistance, about 53% above current levels, and a weekly close above it that survives a retest would be the first real sign of a trend change.
Beyond that, a marked supply zone sits beneath 0.296776, followed by 0.402349, 0.517044, and 0.670445.
Until the box breaks, this remains a consolidation, not a recovery.
How High Can Pi Go in 2028? Scenarios From the Weekly Chart
Timing stays conditional. For the Pi Network Price Prediction 2028, the path would need several weekly closes above each zone, and a recovery after 2027 could just as easily slip further out if demand lags the unlock schedule.
Can Pi Network Reach $1 in 2028?
In any Pi Network price forecast 2028, a move to $1 would be roughly an 11-fold rise from today's price, and the highest level on the chart is 0.670445, which is itself about 7.6 times current levels.
So $1 sits outside every mapped zone. It is a headline scenario, not a forecast.
It would need the supply overhang absorbed, genuine app demand and a broadly strong market. The more grounded question is whether PI can clear 0.135509 first.
Key Risks for PI Price in 2028
Locked rewards turning into unlocked supply are the biggest structural risk, since only about 11% of the 100 billion maximum circulates today.
Trading volume is thin, so price can gap sharply in either direction.
A weekly close under 0.067604 would break the base. Low RSI shows momentum is still weak, and utility growth in the app ecosystem has to arrive before demand can offset new supply.
Wider crypto weakness could also overpower the setup.
Expert Opinion on Pi Network Price Outlook
As per the analyst desk, the Pi Network Price Prediction 2028 starts from a base-building asset, not yet a trending one.
The tight consolidation above support and the steady developer updates are positives, but unlock-driven supply and thin liquidity cap conviction.
In this Pi coin price analysis, a confirmed weekly break above 0.135509 is the earliest signal worth acting on, and 0.067604 is the line that protects the whole thesis.
Conclusion
The Pi Network Price Prediction 2028 depends on three things working together: a base that holds at 0.067604, a clean break through 0.135509, and demand strong enough to absorb unlocking supply.
If those align, the Pi crypto prediction opens toward 0.296776 and higher zones. If not, the base may give way.
The Pi Network future price will be written by weekly closes and real utility, not by hype.
Disclaimer: This article is for informational purposes only and is not financial advice. Cryptocurrency markets are highly volatile, and price scenarios are conditional, not guaranteed. Always do your own research before making investment decisions.