

Is the token compressing for a breakout, or is the squeeze just a pause before another leg lower?
The Pi Network Price Prediction 2026 debate is getting louder as the weekly chart tightens inside a falling wedge after a brutal slide from post-listing highs.
Volume is thin, sentiment is cautious, and the next decisive move could arrive sooner than many traders expect.
PI Price Today: Where Does Stand Right Now?
The token is trading near $0.0882, down about 3.76% on the day, according to CoinMarketCap data, which places the token around 69th by market capitalization. 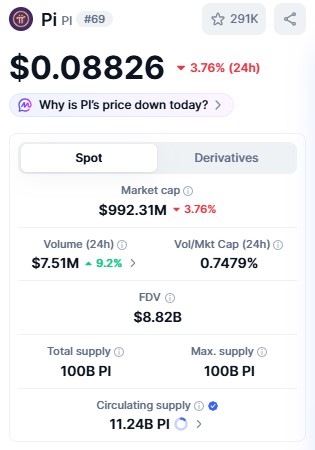
Any Pi network price prediction today starts with a market cap close to $992 million, a fully diluted valuation near $8.82 billion, and a spot volume of roughly $7.51 million, up 9.2% over 24 hours. 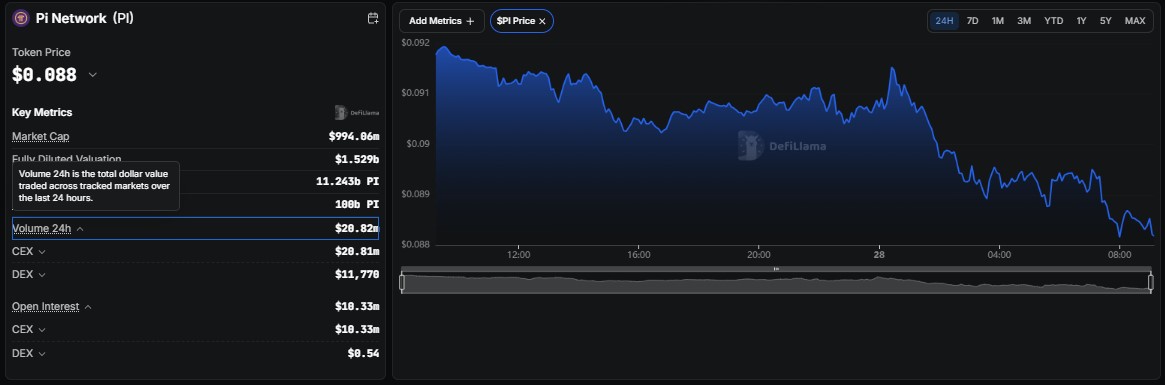 DefiLlama data puts total volume across tracked markets near $20.82 million, with almost all of it on centralized exchanges and only about $11,770 on decentralized venues.
How Much Supply Is Actually Circulating?
Circulating supply sits near 11.24 billion tokens out of a 100 billion maximum, roughly 11% of the total.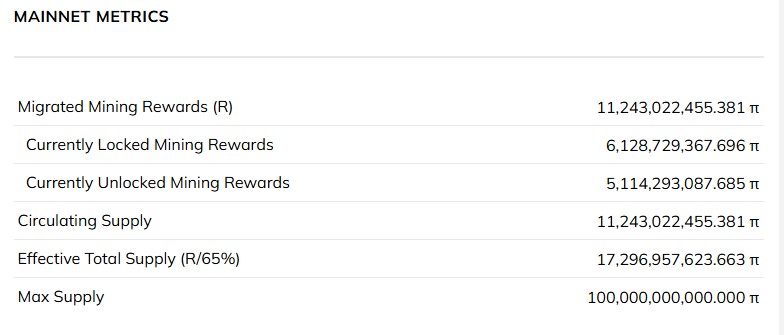
The Pi mainnet explorer shows about 6.13 billion tokens in locked mining rewards and 5.11 billion unlocked, with an effective total supply near 17.30 billion.
Those locked and unlocked balances matter because future unlocks could add selling pressure while demand stays modest.
What Do Derivatives Show Right Now?
CoinMarketCap's derivatives data lists open interest near $18.7 million, down about 20.3% on the day, while derivatives volume of roughly $21.61 million slipped 10.31%.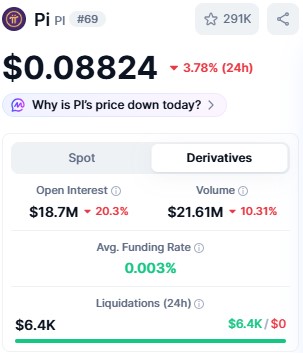 That volume runs close to three times spot turnover, so futures activity drives much of the trading.
The average funding rate is barely positive at 0.003%, and 24-hour liquidations total only about $6,400, all from longs.
Falling open interest and tiny liquidations point to a market with little leveraged conviction in either direction.
Pi Network Weekly Chart: What Is TradingView Showing?
The weekly chart shows Token sliding from levels near $1 into a falling wedge, with a descending trendline capping every rally. 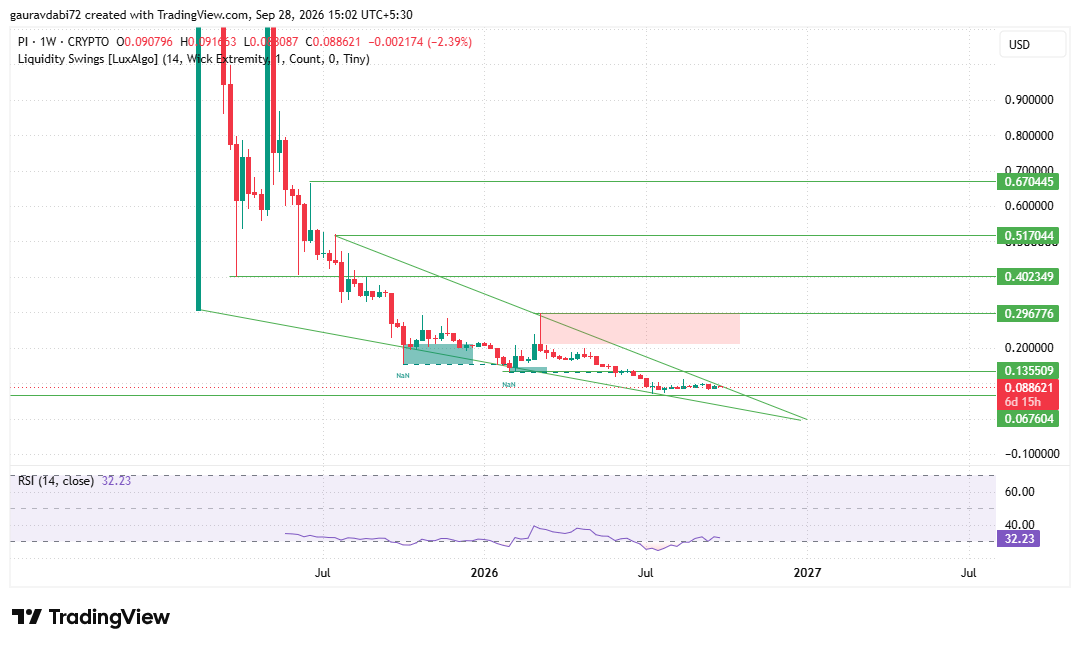
Price is compressing in the lower half of the pattern near $0.0886, and RSI sits around 32, close to oversold territory.
This weekly chart analysis also highlights a supply zone between roughly $0.21 and $0.30 that could stall any recovery.
Resistance levels to watch sit at $0.1355, $0.2968, $0.4023, $0.5170, and $0.6704. Support sits at $0.0676, with the $0.0600 area as the make-or-break zone.
What Could Pi Network Price Do Next?
Anyone asking will Token reach $0.30 first and needs a breakout above the descending trendline and a weekly close over $0.1355.
What Are the Key Risks to Watch?
The descending trendline is still intact, volume remains weak, and no clear higher low has formed yet.
Future unlocks of mining rewards could add supply, and the thin decentralized trading base means exchange-driven moves can swing price quickly.
A break under $0.0676 would confirm further weakness.
Expert Opinion: What Does the Analyst Desk Think?
As per the analyst desk, a falling wedge often precedes a bullish reversal, but only after price actually breaks the upper trendline.
The Pi Network price prediction 2026 outlook stays cautious until that happens, since the current setup reads as compression, not confirmation.
Conclusion
The token is stuck in a tightening pattern with weak volume, heavy locked supply, and light derivatives interest.
Whether this Pi Network price prediction 2026 stretches toward $0.30 and beyond, and whether is Pi Network a good investment 2026 deserves a yes for any given trader, depending on a confirmed wedge breakout.
Disclaimer: This article is for informational purposes only and should not be treated as financial or investment advice. Cryptocurrency markets are highly volatile, and readers should conduct their own research before making any investment decisions.





