Can Bitcoin really climb to $1 million? The Bitcoin price prediction 2030 debate keeps growing as the weekly chart shows buyers rebuilding after a deep correction, even though the road to seven figures is long.
Here is how the Bitcoin forecast looks today.
BTC Market Cap, Supply and Chain Data
According to Blockchain.com data, Bitcoin has a market cap near $1.683 trillion, with 20,094,687 BTC circulating against a 21 million cap. 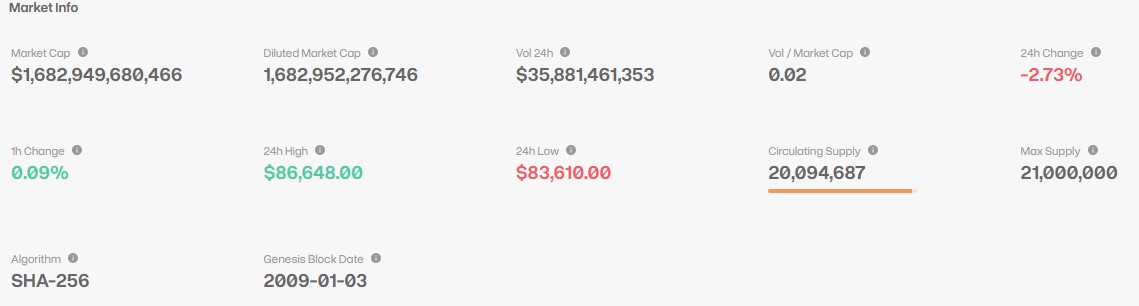
The 24-hour range runs from $83,610 to $86,648, and volume reached $35.88 billion. 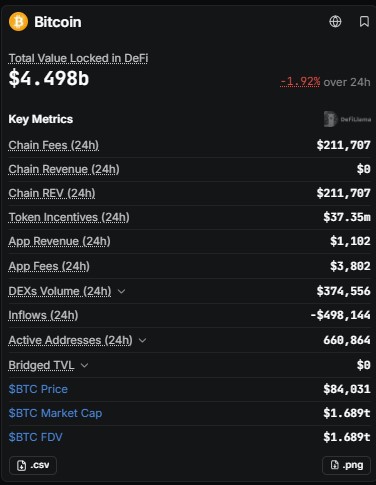
DefiLlama data adds 660,864 active addresses and $4.498 billion in DeFi TVL, down 1.92% over 24 hours.
Bitcoin Open Interest: Is Leverage Rebuilding?
Per Coinglass, BTC trades near $83,868.8, down 2.57%, with open interest at $55.30 billion. 
Futures volume of $60.02 billion dwarfs spot volume of $5.62 billion.
On the Coinglass chart, open interest rose from about $48 billion in July to above 60,000s to the high $80,000s. 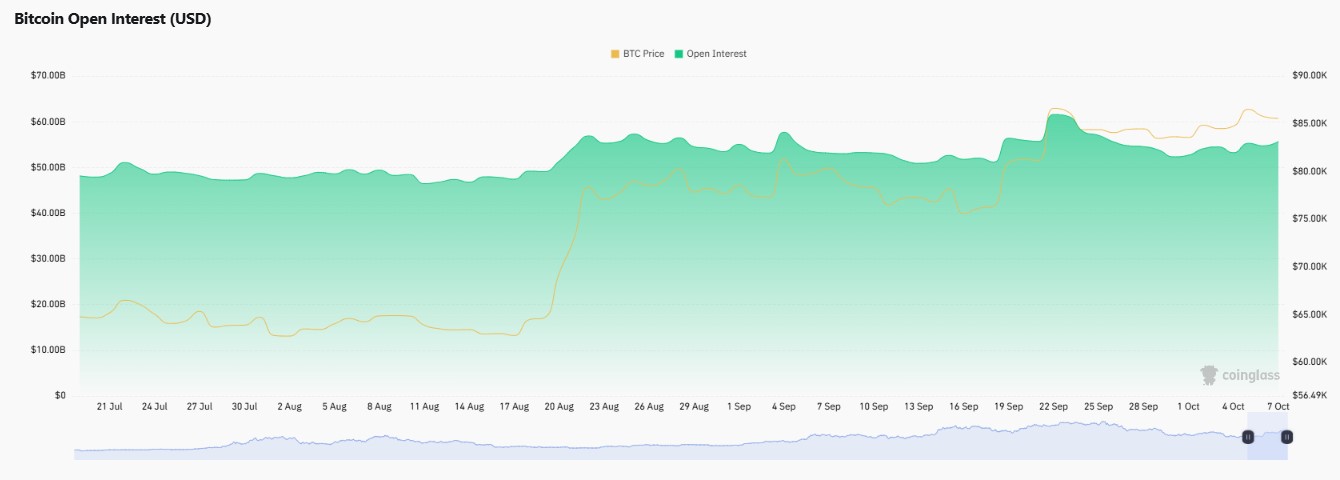
It has cooled since, so the read is mixed: leverage is well above its summer base but off its peak.
Bitcoin News: Rising Yields Meet Muted Volatility
An X post by Kraken Pro says BTC gained 43% in the third quarter while long-term yields climbed to generational highs, and volatility stayed unusually muted.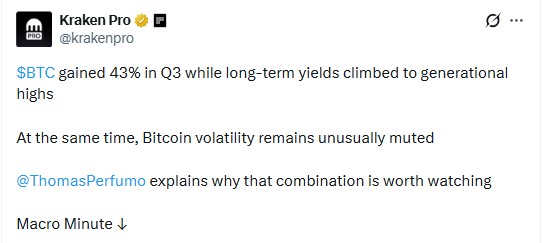 Strong gains against a tight macro backdrop with low volatility can precede a bigger move, so reactions at resistance matter.
Bitcoin Weekly Chart Analysis: Rounding Bottom Near Resistance
Per TradingView chart data on the Bitstamp weekly timeframe, BTC slid from the 126,203 area into a broad rounding bottom, then a strong weekly candle pushed price through the descending trendline that capped the decline. 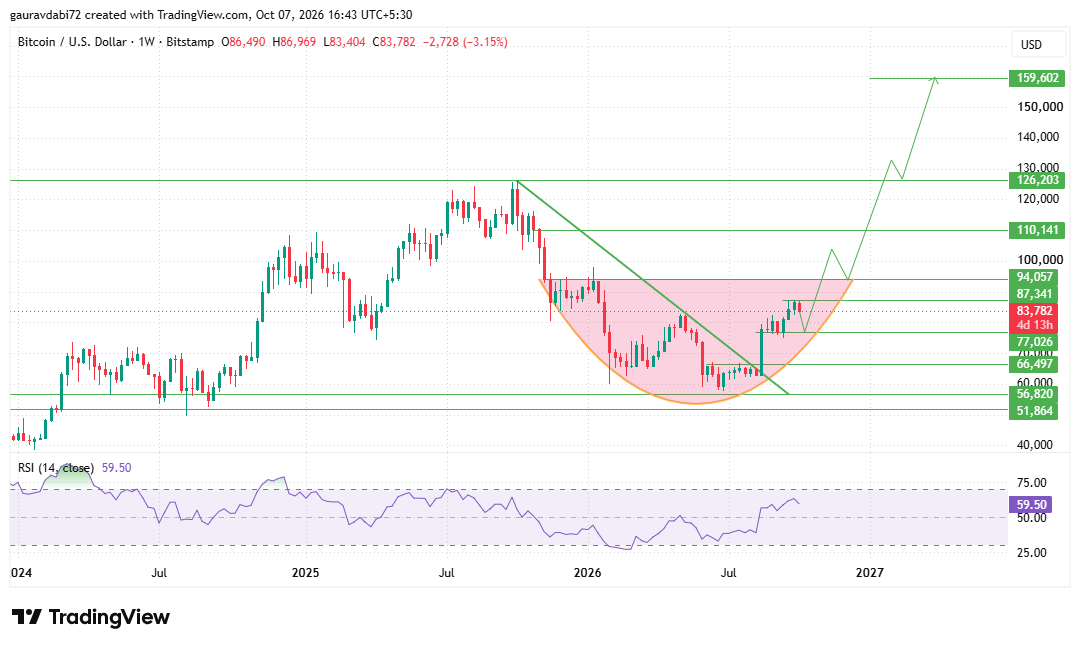
The latest weekly candle opened at 86,490, reached 86,969, and traded near 83,782, down 3.15%, so the price is stalling under first resistance at 87,341.
A weekly close above 87,341 and then 94,057, the rim of the rounding bottom, would confirm the pattern and open 110,141, 126,203, and 159,602.
On the downside, 77,026 is first support, followed by 66,497, 56,820, and 51,864.
RSI at 59.50 is firm but not overbought, so momentum favors buyers without being stretched.
Bitcoin Price Prediction 2030: Forecast Levels and Scenarios
In the base case, the Bitcoin price forecast is a range between 77,026 and 87,341, while buyers test the rim.
In the bull case, a weekly close above 94,057 opens the higher levels in steps.
In the bear case, a break below 77,026 would expose 66,497.
So, can BTC hit $1 million? The chart maps nothing above 159,602. From today's price, $1 million means roughly a 12x move and a market cap near $20 trillion on current supply.
That makes it a long-horizon stretch scenario, not a base case.
For an earlier outlook, check out our Bitcoin Price Prediction 2029 and see how BTC’s key levels and market trend have evolved.
Key Risks for BTC
A rejection at 87,341 would turn the rounding bottom into a range. Futures volume roughly ten times spot means leverage can unwind fast, and rising long-term yields can pressure risk assets.
Expert Opinion on BTC
As per the analyst desk, the structure is constructive: the trendline is broken and the rounding bottom is intact.
Still, the price has not cleared 87,341, so confirmation matters more than the pattern.
Conclusion
Holding above 77,026 keeps the recovery structure alive, while a weekly close above 94,057 would strengthen the case for the higher levels in this outlook.
Disclaimer: This article is for informational purposes only and is not financial advice. Cryptocurrency is volatile, so always do your own research before making any decision.