

Is Bitcoin quietly building the base for its next big leg? Bitcoin is currently trading near $84,200 on the monthly timeframe, and the structure is starting to look explosive.
After a brutal slide that shook confidence, BTC has stopped bleeding and started climbing again.
The real question is whether this recovery can carry into next year, and that is exactly what this Bitcoin price prediction 2027 outlook sets out to answer.
Bitcoin Price Today: Where Is BTC Trading Right Now?
Coin is changing hands near $84,203, up 1.41% over 24 hours, according to Coinglass.
Market cap sits at $1.68 trillion, with 20.09 million of the 21 million maximum supply already in circulation.
Futures volume of $57.09 billion dwarfs spot volume at $4.39 billion, a reminder that derivatives desks drive much of the daily action.
How Has Bitcoin Performed This Year?
It has been a year of two halves. Per TradingView chart data, BTC spent months sliding inside a falling channel that began near the 126,203 peak zone and dragged price toward the 58,103 area.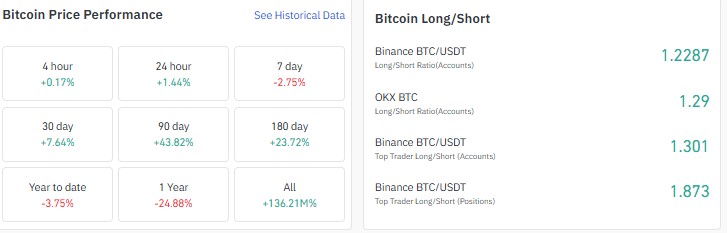
Coinglass still shows a 3.75% loss year to date and a 24.88% drop over one year. The recent tape tells a different story.
Coin has added 7.64% in 30 days, 23.72% in 180 days, and a striking 43.82% in 90 days, while the latest seven-day dip of 2.75% looks more like a breather than a break.
Are $BTC Traders Leaning Long? Long-Short Ratio and Liquidations
CoinGlass puts the Binance BTC/USDT account ratio at 1.2287, OKX at 1.29, and Binance top traders at 1.301 by accounts. 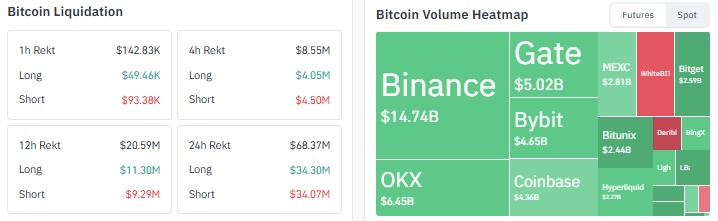
The standout is the top trader position ratio at 1.873, which shows larger players carrying clearly more long exposure than short.
Liquidations over 24 hours reached $68.37 million, split almost evenly between longs at $34.30 million and shorts at $34.07 million.
The flush hit both sides, so the bias leans long without looking crowded.
Bitcoin Open Interest: Is Leverage Rebuilding?
Open interest stands near $52.84 billion per Coinglass, well below the peaks above $60 billion in the chart printed in January and May.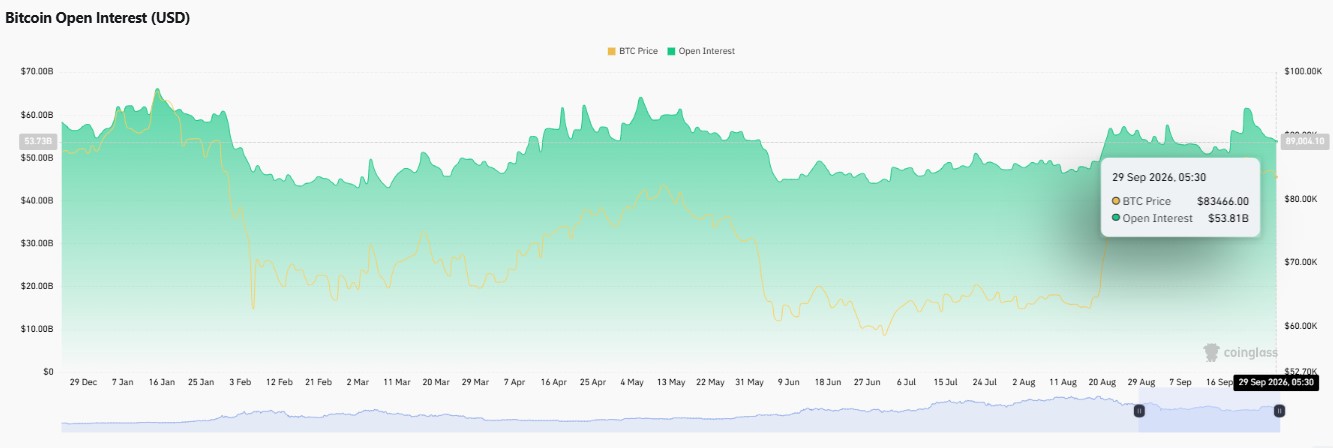
That gap matters. Price has climbed without leverage, returning to its earlier extremes, which suggests the rally is not overheated and leaves room for fresh positioning if buyers keep pressing.
Is Bitcoin Network Activity Picking Up?
Data from the blockchain.com explorer shows active addresses at 491K, up 18.0% in 24 hours, while transactions rose 3.3% to 780K.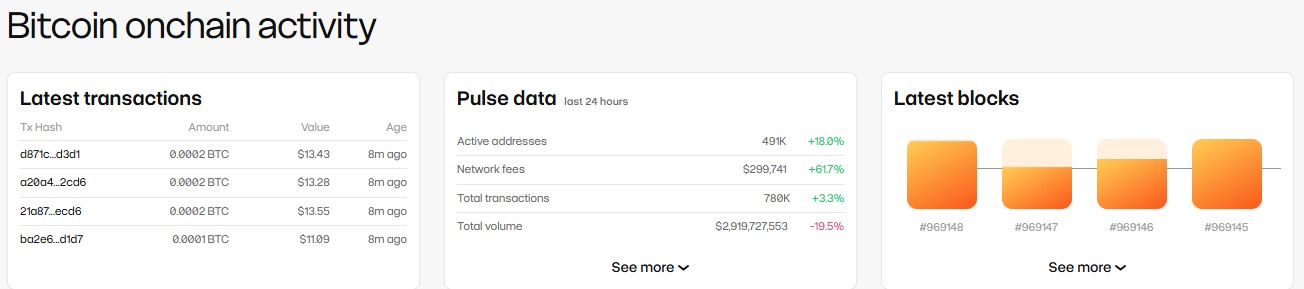
Network fees jumped 61.7% to $299,741. Total transfer volume slipped 19.5% to about $2.92 billion, so usage is improving even as the value moved.
It is a mixed read, but the address growth is worth noting.
Why Is Strategy Buying Bitcoin Again?
According to an X post by BSCNews, Strategy added 1,666 BTC worth roughly $138 million at an average price near $82,833 per coin. 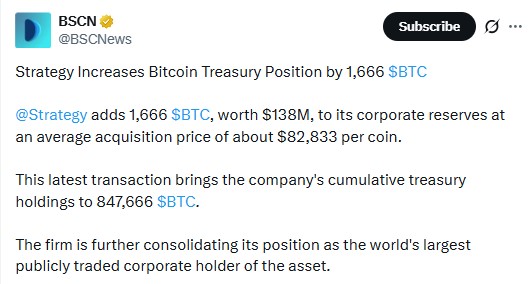
The purchase lifts its cumulative treasury holdings to 847,666 BTC. With the average sitting just under the current market, institutional interest stays visible at these levels, which supports the broader constructive tone.
What Does the Bitcoin Weekly Chart Say About the Recovery?
Looking at the higher timeframe on TradingView, Token has escaped the falling channel that capped every rally for months.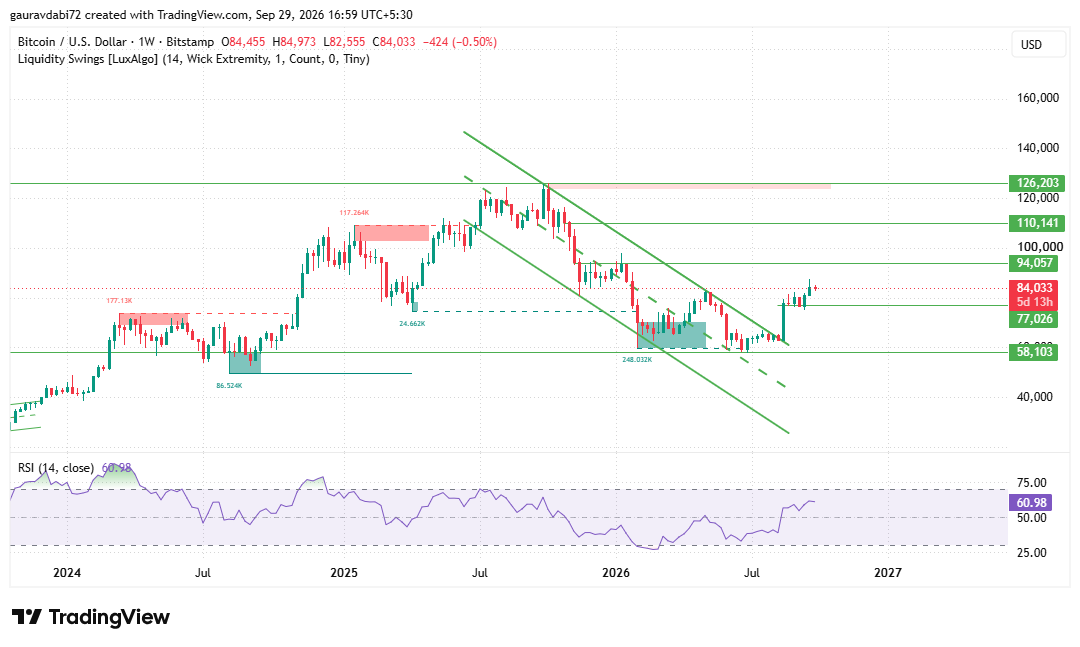
Price now sits near $84,033 and has held above the breakout area, a classic sign of bullish structure taking shape. RSI reads 60.98, comfortably positive but nowhere near overbought.
Immediate resistance sits at 94,057, followed by 110,141 and then 126,203. On the downside, 77,026 is the key support buyers need to protect, with 58,103 as the deeper floor.
Is a Bitcoin Rounding Bottom Forming on the Monthly Chart?
Zoom out further and the picture gets more interesting. The monthly TradingView chart traces a wide, curved base running from the highs down toward the 56,820 area and back up, with the current candle up 7.16% near 84,200.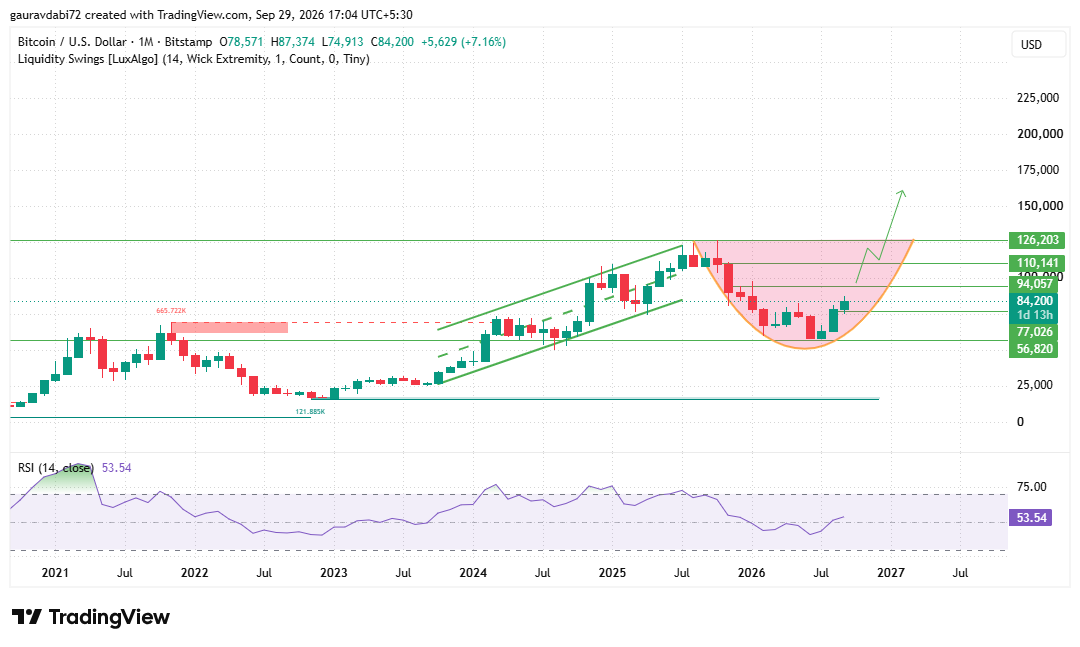
RSI at 53.54 has just climbed back above the midline, which fits a market shifting from recovery into early expansion.
The level that matters most is 94,057. A monthly close above it would bring 110,141 into play, and a complete rounding bottom would need 126,203 to give way.
Only beyond that does the projection drawn on the chart, pointing toward the $150,000 area, come into the frame.
What Needs to Change for $BTC to Reach $150,000 in 2027?
Four things. First, a decisive monthly close above 94,057 to flip resistance into support.
Second, open interest climbing back toward the $60 billion zone alongside rising prices, not against it.
Third, on-chain transfer volume recovered after this week's 19.5% drop, showing real demand behind the move.
Fourth, continued treasury buying like Strategy's latest purchase. Miss one and the rally can stall.
Land all four, and the Bitcoin price forecast 2027 turns far more aggressive.
Bitcoin Price Prediction 2027: What Are the Possible Scenarios?
What Are the Key Risks for Bitcoin in 2027?
Resistance at 94,057 is still untested, and rallies often pause at such levels. Futures volume runs far above spot, so leverage can turn quickly if longs get crowded.
Falling transfer volume and a negative year-to-date return also show the recovery is unfinished.
A break under 77,026 would weaken the structure fast.
Expert Opinion: Is Bitcoin a Good Investment for 2027?
As per the analyst desk, the Coin case for 2027 rests less on one signal and more on alignment.
A weekly channel escape, a curved monthly base, and steady treasury buying are pulling in the same direction, while long-heavy top trader positioning adds fuel.
Moderate open interest suggests the market has not overreached.
Confirmation still has to come from a monthly close above 94,057, and until then the bias stays constructive, not guaranteed.
Conclusion
Coin enters the final stretch of 2026 with better footing than it has had in months.
The channel is broken, the monthly base is taking shape, and buyers with deep pockets are still active.
The road toward $150,000 runs through 94,057 and 126,203, and how price behaves at those levels will decide whether this Bitcoin price prediction 2027 plays out as the bull case or fades into a range.
Disclaimer: This article is for informational and educational purposes only and does not constitute financial, investment or trading advice. Cryptocurrency prices are highly volatile and carry significant risk. Please do your own research and consult a licensed financial advisor before making any investment decision.





