

Can a network that moves billions in stablecoins every day turn steady usage into a price that surprises in 2040?
The TRON price prediction 2040 debate is back on the table as the monthly chart keeps climbing inside a channel and the on-chain numbers keep growing.
Traders want to know whether TRX can finally match its network strength or stay stuck in a slow grind.
TRON Price Today: Market Stats Behind the 2040 Outlook
Data as of 15 October 2026. TRON trades near $0.33, up 0.10% over 24 hours, per DefiLlama data. 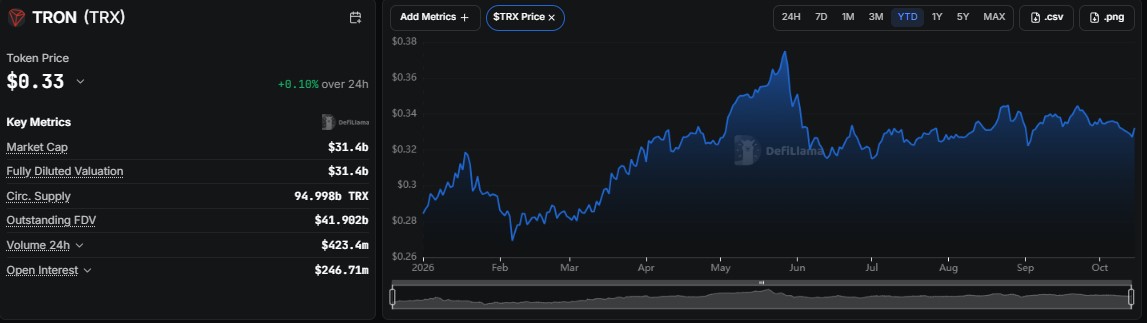
Market cap and fully diluted valuation are both $31.4 billion, with 94.998 billion $TRX circulating. Outstanding FDV is $41.902 billion, and 24-hour trading volume is $423.4 million.
The year-to-date chart tells a patient story. $TRX bottomed near $0.27 in February, rallied to a peak around $0.375 in late May, and has since moved sideways between roughly $0.32 and $0.345.
This $TRX price analysis starts from a market that is quiet on the surface.
TRX Open Interest: Leverage Rises Again Above the Summer Base
Per Coinglass, TRX open interest sits near $325 million. It topped out around $380M in late May alongside the price peak, drifted back to roughly $250 million to $300 million through the summer, and then jumped to about $345 million in early October.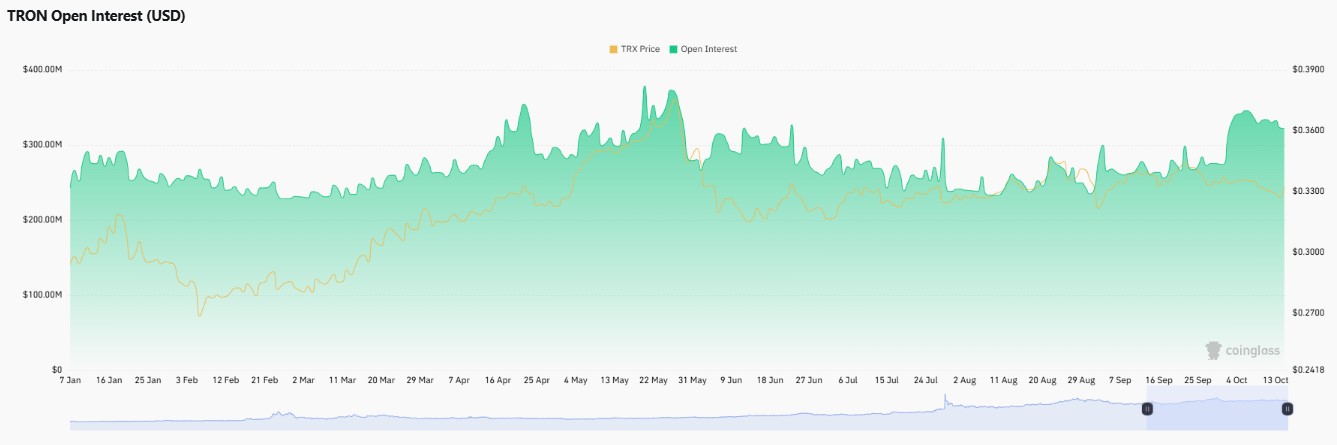
Rising leverage while price barely moves suggests traders are positioning for a bigger move.
That can help the TRX forecast if buyers win, though it also raises liquidation risk if price slips out of its channel.
TRON Network Activity on Tronscan
Tronscan data shows 245.66 million holders and 6.25 billion total transfers. Yesterday brought 4.24 million transfers, down 6.55%, and $623.12 million in trading volume, down 0.80%. Circulating supply is about 94.997 billion TRX, almost all of the total supply.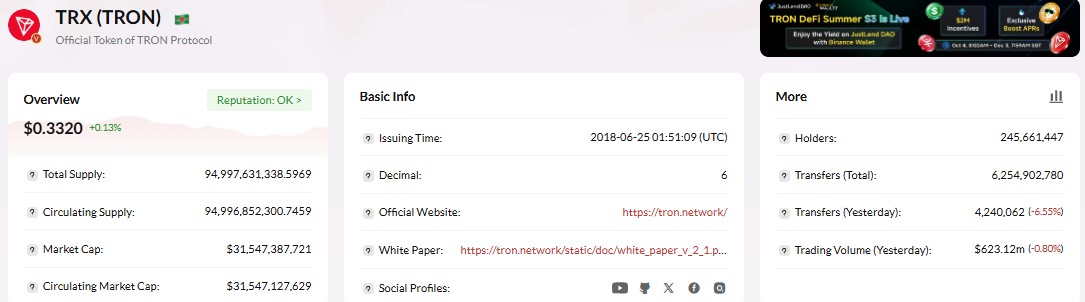
The network stays busy, though the small daily dip is a reminder that activity moves in waves.
TRON Stablecoin Supply Grows Faster Than Nine Chains Combined
A TRON DAO post on X quotes Token Terminal data showing stablecoin market cap on TRON rose by $554.9 million over seven days, more than the next nine chains combined. 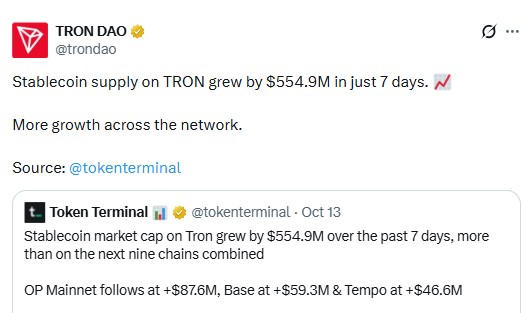
OP Mainnet followed at $87.6 million, Base at $59.3 million, and Tempo at $46.6 million.
Stablecoin demand is the foundation of the TRON story, and this growth supports the long-range case.
TRON Crosses $30 Trillion in Cumulative Volume
A post from Coinvo on X says TRON has passed $30 trillion in cumulative transaction volume. 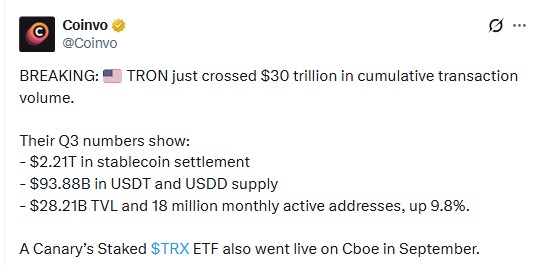
Its Q3 figures list $2.21 trillion in stablecoin settlement, $93.88 billion in USDT and USDD supply, $28.21 billion in TVL and 18 million monthly active addresses, up 9.8%.
It also notes that Canary's Staked TRX ETF went live on Coinbase in September.
The numbers come from a social post, but together they show a network growing in usage while a regulated product opens a new door for TRX demand.
TRON Monthly Chart: Ascending Channel Holds Near the Bottom Line
Per TradingView monthly chart data, TRX has been climbing inside an ascending channel since the end of 2024. 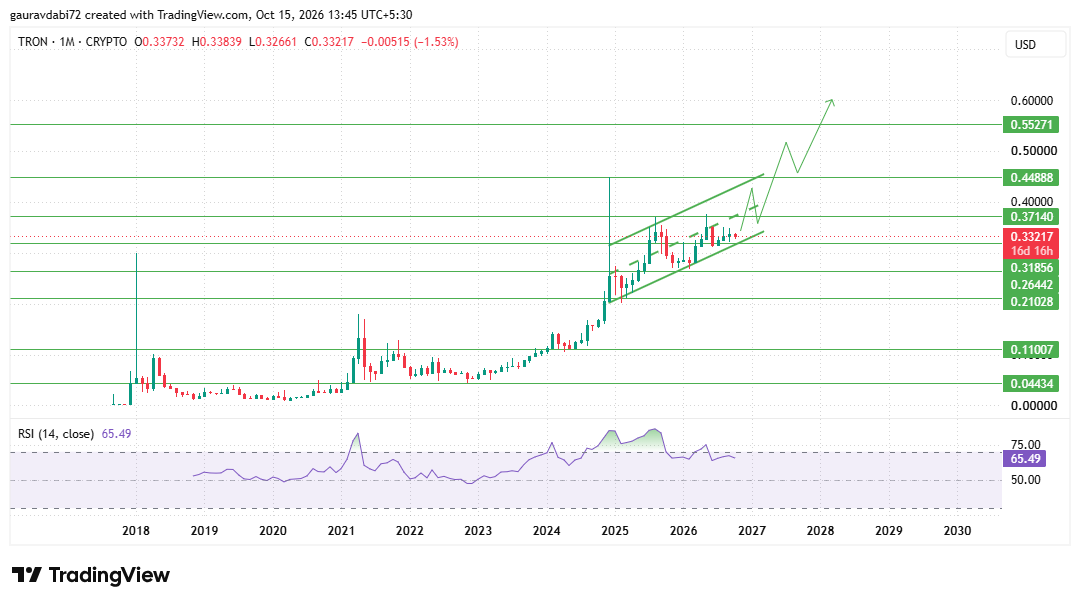
Each pullback has found support near the lower line, and each push has stalled before the upper line.
Price now trades near 0.332, hugging the bottom of that channel after a small red monthly candle.
This is the area where an ascending channel either proves itself or loses its footing, so buyers need to defend it.
A monthly close that rebuilds momentum and clears 0.3714 would be the first sign of strength.
From there, 0.4489 is the next resistance and sits close to where the upper channel line is heading, with 0.5527 as the highest chart level.
On the downside, 0.3186 is the first support, and a break below it would expose 0.2644, then 0.2103.
RSI at 65.49 sits in the upper half, so momentum is firm without being stretched.
For an earlier outlook, check our TRON Price Prediction 2030 and see how TRX's key levels and market trend have evolved.
Can TRX Break Above $20? What the Math Requires
Start with the numbers. From $0.332, $20 is roughly a 60x move. Today's 94.998 billion circulating supply implies a market cap near $1.9 trillion, against $31.4 billion now.
The base case for this TRON price prediction 2040 is a slow climb along the channel, with price oscillating between 0.3186 and 0.4489.
The bull case needs a monthly close above 0.3714 that holds, then a push through 0.4489 toward 0.5527.
The bear case is a monthly close below 0.3186, which puts 0.2644 in play.
The highest chart level of 0.5527 is about 1.7x from here and would imply a market cap near $52.5 billion.
Anything near $20 rests on decades of stablecoin and payments growth that nobody can verify today, which makes it a stretch within any TRX forecast.
Key Risks for TRX's Long-Range Outlook
A monthly close below the channel floor would damage the structure that has held for two years.
Competition for stablecoin flows is rising, as shown by Base, OP Mainnet,, and Tempo posting gains.
Open interest near $325 million adds liquidation risk, regulatory pressure on stablecoins can hit usage, and Bitcoin correlation still guides altcoins.
Analyst Desk View on TRON
As per the analyst desk, TRX has the strongest fundamentals relative to its price among large caps, with stablecoin growth and a Cboe-listed staked ETF adding fresh support.
The channel is intact, and the RSI is healthy. Yet price has gone nowhere since May, and bottom-of-channel tests only matter if buyers respond.
A monthly close above 0.3714 would be the first clean signal that the TRX forecast is strengthening.
Conclusion
The TRON price prediction 2040 starts from a constructive but patient position. A rising channel, record stablecoin demand and a new ETF route support the bullish case, while the 0.3186 floor and the 0.3714 ceiling define the next test. Until a monthly close above 0.3714 holds, caution is advised. Market data in this article was last updated on 15 October 2026.
Disclaimer: This article is for informational and educational purposes only and is not financial advice. Cryptocurrency prices are highly volatile, and long-term price predictions are speculative.





