
Is Solana quietly building the base for its next big leg higher? After a long grind off the lows, SOL is pressing against the top of a rising weekly structure, and traders are already asking what the Solana Price Prediction 2028 could look like if that ceiling finally gives way.
The setup is constructive but not confirmed. Everything depends on how price behaves at one boundary, and the zones beyond it shape every realistic Solana price forecast 2028 scenario.
SOL Price Today: Market Cap, FDV and Supply
Solana is changing hands near $119.3, down about 1.4% over 24 hours, according to Coinglass.
The same page lists a market cap of $70.13 billion, a circulating supply of 588.4 million, and a total supply of 635.15 million.
DefiLlama data puts the fully diluted valuation at $75.65 billion, so the gap between market cap and FDV is modest. 
On-chain, Solscan shows the current supply near 634.99 million with 9 decimals. Spot volume stands at $1.01 billion.
Is Leverage Driving the Solana Open Interest Picture?
Futures volume of $9.37 billion over 24 hours dwarfs the $1.01 billion in spot, roughly a nine-to-one gap, while open interest sits at $7.12 billion, per Coinglass.
Derivatives traders clearly set the pace here.
That helps a breakout move fast, but it also means a failed push can reverse just as quickly.
With only a single reading and no long-short split, the signal is mixed rather than decisively bullish.
Tokenized Equities Lift Solana Ecosystem Growth
Solana's official X post says tokenized equities on the network reached an all-time high of 1.2 million holders, with 775,000 joining in September alone, citing Token Terminal data. 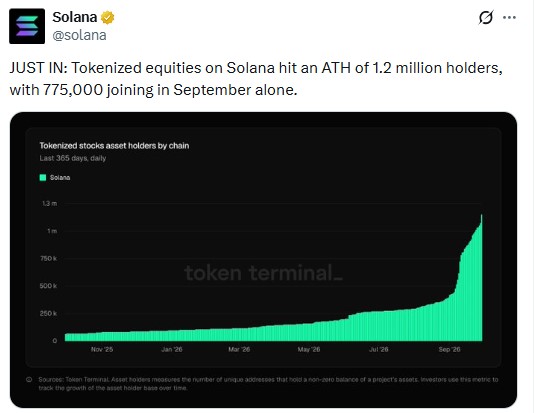
The chart attached to the post shows the count moving almost vertically through the month after a long, slow build.
For Solana ecosystem growth, that matters because real-world asset demand brings users who are not simply chasing price.
It supports the wider case for Solana crypto growth potential, though it is a usage signal and not a price guarantee.
Solana DeFi Ecosystem and Network Activity Data
Per DefiLlama, total value locked across the Solana DeFi ecosystem is $6.615 billion, up 0.95% in 24 hours.
The stablecoin market cap on the chain is $16.651 billion, and active RWA assets under management are $2.499 billion. 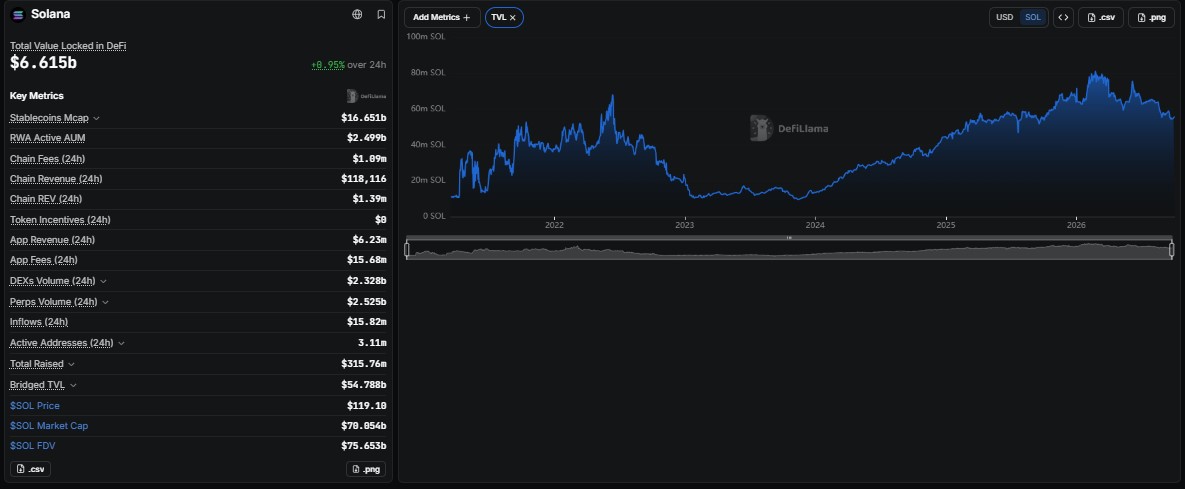
DEX volume of $2.328 billion and perps volume of $2.525 billion, backed by 3.11 million active addresses, point to healthy Solana network activity.
Chain fees came to $1.09 million, with chain revenue of $118,116. One caution is that TVL measured in SOL sits near 55 million, well below its 2026 high above 80 million. Solana Price Prediction 2028
SOL Weekly Chart Analysis: Ascending Channel Near the Upper Boundary
Looking at the higher timeframe on the SOL/USD weekly chart from TradingView, Solana has been climbing inside an ascending channel since it bottomed near 62.51 earlier this year.
Buyers defended the lower channel line again in August, and the price has since pushed well above the 97.18 area. 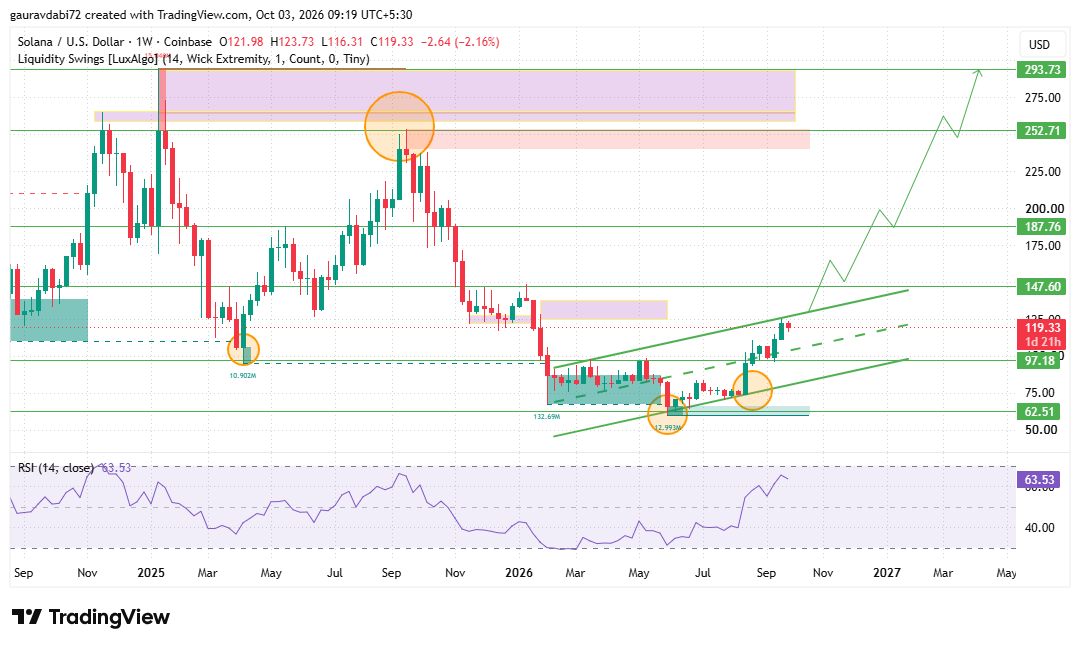
It now trades around 119.33, just under the upper boundary, a line that has capped every rally so far.
That boundary is the make-or-break level. In this SOL technical analysis, a weekly close above it, followed by a hold on the retest, would open the path toward 147.60, the first resistance.
Above that, 187.76 comes next, then 252.71, where the chart marks a heavy supply zone, and finally 293.73 at the top of the mapped range.
RSI reads 63.53, strong but short of overbought, which leaves room for another leg.
On the downside, 97.18 is the first support, and 62.51 remains the major floor.
A weekly close back below 97.18 would weaken the bullish structure.
How High Can Solana Go in 2028? Scenarios From the Weekly Chart
Timing stays conditional. A move through these zones could unfold across 2027, with 2028 carrying the continuation only if the rising structure survives each test.
This broader Solana long-term price outlook hinges on repeated weekly closes above resistance, not a single spike.
Can Solana Reach $500 or $1,000 by 2028?
The highest zone on the weekly chart is 293.73. Both $500 and $1,000 sit beyond it, and they would mean roughly a fourfold and eightfold rise from current levels. Those figures are headline scenarios, not forecasts.
Reaching them would require every zone above to break cleanly, sustained growth in usage, and broad risk appetite across the market.
Without that, 293.73 is the more grounded ceiling for the Solana all-time high conversation.
Key Risks for Solana Price in 2028
A rejection at the upper channel boundary could drag the price back toward 97.18. Leverage-heavy trading, with futures volume far above spot, raises the odds of sharp reversals.
TVL in SOL terms remains well under its 2026 high, so on-chain depth is thinner than at the peak.
Wider crypto weakness or Bitcoin correlation could also override a clean technical setup.
Expert Opinion on Solana Price Outlook
As per the analyst desk, the structure favors buyers while price holds inside the channel, and the Solana bullish outlook strengthens only after a confirmed weekly break of the upper boundary.
The record tokenized equities holder count and steady on-chain activity add support, yet derivatives dominance argues for patience.
In this Solana market analysis for 2028, the 147.60 area is the first real test of conviction, and 97.18 is the line that protects the thesis.
Conclusion
Solana enters the long road to 2028 with a rising weekly channel, improving on-chain demand, and a clearly defined set of levels.
A confirmed break and hold above the upper boundary would keep the Solana crypto prediction pointed toward 147.60 and 187.76, with higher zones possible after that. Failure to hold 97.18 would reset the picture.
The Solana future price will be decided by weekly closes, not headlines. Solana Price Prediction 2028
Disclaimer: This article is for informational purposes only and is not financial advice. Cryptocurrency markets are highly volatile, and price scenarios are conditional, not guaranteed. Always do your own research before making investment decisions.