Can Shiba Inu ever make a run at levels that sound almost impossible today? This Shiba Inu Price Prediction 2030 weighs a tightening monthly structure, a holder base dominated by a few wallets, and cooling leverage against the long road ahead.
Sellers have lost some momentum, yet buyers are still waiting to prove themselves.
Whether the story turns bullish depends on a handful of levels and on what the largest holders do next.
Shiba Inu Price Today: Market Cap, Volume and Supply Data
SHIB trades near $0.000005387, down 0.43% over 24 hours, according to Coinglass. 
Market cap is $3.16B, with 589.23T tokens circulating against a 589.55T maximum, so nearly all supply is already live.
Futures volume of $58.16M is about 2.5 times spot volume of $23.08M, a sign that leveraged traders drive most of the action. 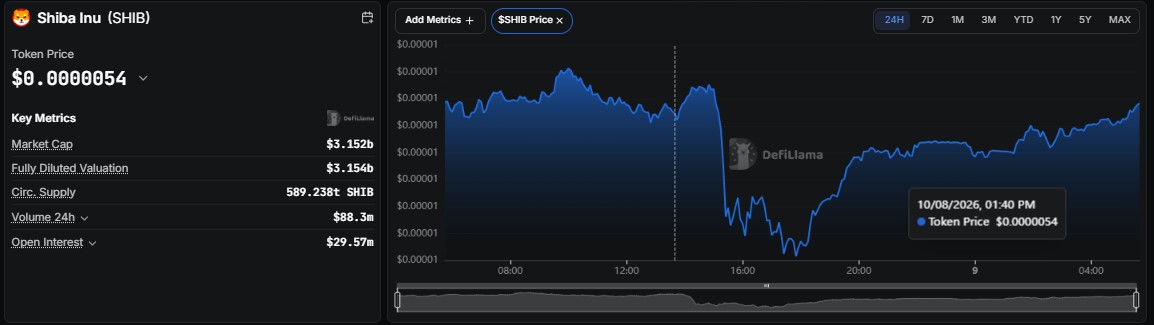
DefiLlama puts fully diluted valuation at $3.154B and 24-hour volume at $88.3M, and its 24-hour chart shows a sharp drop on 8 October that has since been mostly recovered.
SHIB Whale Concentration: Who Holds Most of the Supply?
Supply is heavily concentrated, per Etherscan holder data. The top 100 wallets hold 82.85%, the top five alone account for 57.95%, and seven holders own at least 1% each. 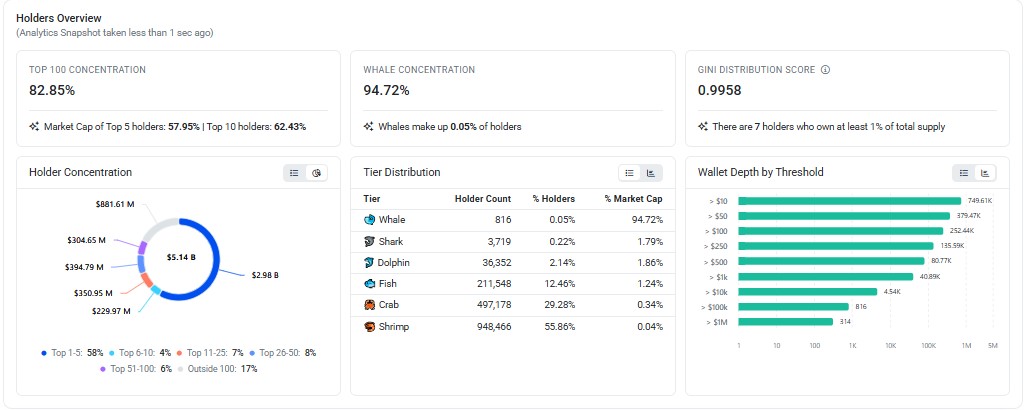
Whale-tier wallets number just 816, or 0.05% of holders, yet they control 94.72% of the supply, while 948,466 shrimp wallets make up 55.86% of holders and own 0.04%.
That level of SHIB whale concentration cuts both ways. One large distribution could swamp thin demand, while whale accumulation would move a market this size quickly.
Shiba Inu Open Interest: Are Traders Cutting Leverage?
Per Coinglass, Shiba Inu open interest stands at $57.64M. That is down from roughly $76M in early October and well below the $94M peak in August, so traders are trimming exposure instead of adding to it. 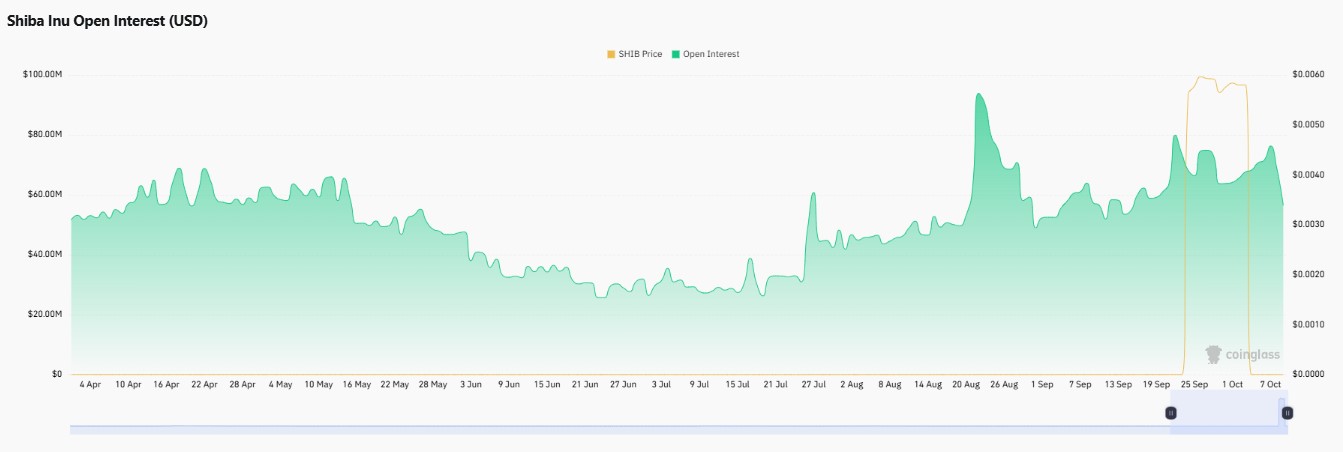
Falling open interest alongside a flat price points to a market waiting for direction.
Fresh growth in open interest as price pushes above the wedge would be the stronger confirmation.
SHIB Price Analysis: Monthly Falling Wedge Near the Squeeze Point
On the monthly chart from TradingView, SHIB has been squeezing inside a falling wedge since the 2024 spike, with lower highs above and a floor that keeps getting tested near 0.00000408, the key support for the whole structure. 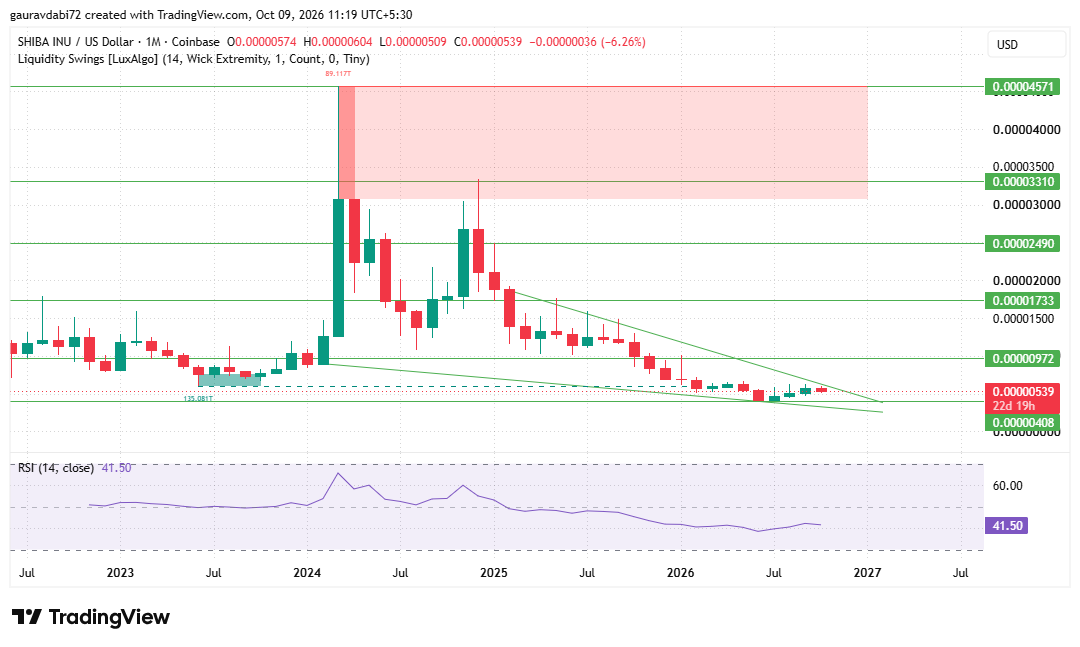
The current monthly candle is red, down 6.26%, and RSI at 41.50 sits below the midline without being oversold.
Momentum is weak, though each decline has been shallower than the last.
Falling wedges often resolve higher, but the pattern only counts after a monthly close above the upper trendline. Until then it is a setup, not a signal.
Overhead, 0.00000972, is the first make-or-break level, about 80% above price, and the first major hurdle on the monthly chart.
Beyond it, the chart marks 0.00001733, 0.00002490, 0.00003310, and 0.00004571, the last sitting at the March 2024 spike high.
Below, 0.00000408 sits about 24% under the current price.
Can Shiba Inu Reach $0.001? What the Numbers Say
At today's price, $0.001 is roughly 186 times higher. At the current circulating supply of 589.23T, it would imply a market cap near $589B, against $3.16B now.
It also sits more than 20 times above 0.00004571, the highest level marked on the monthly chart.
That is why our Shiba Inu forecast treats $0.001 as a distant stretch case, not a base case.
The chart offers a more grounded path, with 0.00000972 first, then 0.00001733 and 0.00002490 if the wedge resolves higher.
A move toward $0.001 would need demand on a scale that current volume and open interest do not hint at.
SHIB Outlook: Base, Bull and Bear Cases
The Shiba Inu Price Prediction 2030 outlook leans on how price handles the wedge. In the base case, SHIB keeps coiling between 0.00000408 and the upper trendline, and RSI curling back above 50 would be the first sign of strength.
The bull case needs a monthly close above the wedge and then a push through 0.00000972, which would open 0.00001733 and, on strong volume, 0.00002490.
The bear case is a monthly close below 0.00000408, which would break the wedge floor and leave no marked level below it.
These SHIB support and resistance levels frame every scenario.
For an earlier outlook, check out our Shiba Inu Price Prediction 2029 and see how SHIB’s key levels and market trend have evolved.
Key Risks for Shiba Inu Holders
A monthly close below 0.00000408 would break the wedge floor. Whale distribution is the obvious tail risk given how few wallets hold the supply.
Futures volume running at roughly 2.5 times spot can exaggerate moves in both directions, and RSI at 41.50 shows momentum still needs repair.
Expert Opinion: How Does the Analyst Desk Read SHIB?
As per the analyst desk, the structure is patient rather than bullish. Compression this tight usually ends in a decisive move, and a whale-heavy holder base raises the stakes either way.
The desk would want a monthly close above the wedge and rising open interest before treating any breakout as real. Until then, 0.00000408 is the line that matters most.
Conclusion
The Shiba Inu Price Prediction 2030 picture rests on a monthly wedge, cooling leverage, and a very concentrated holder base.
Holding 0.00000408 keeps the recovery path toward 0.00000972 alive, while a monthly close below it would put the whole structure at risk. $0.001 stays a distant stretch case.
Disclaimer: This article is for informational and educational purposes only and does not constitute financial, investment, or trading advice. Cryptocurrency prices are highly volatile, and readers should do their own analysis and consider their risk tolerance before making any decision.