

Can a token that has spent most of the year grinding sideways really climb into a new era by 2040?
The Polkadot price prediction 2040 debate is back in focus as the daily chart builds a tight structure and the network pushes a fresh, user-first direction.
Traders are asking whether this coil can turn into lasting strength or fade like earlier attempts.
Polkadot Price Today: Market Stats Behind the 2040 Outlook
Data as of 15 October 2026. Polkadot trades near $1.11, down 5.55% over 24 hours, per DefiLlama data. 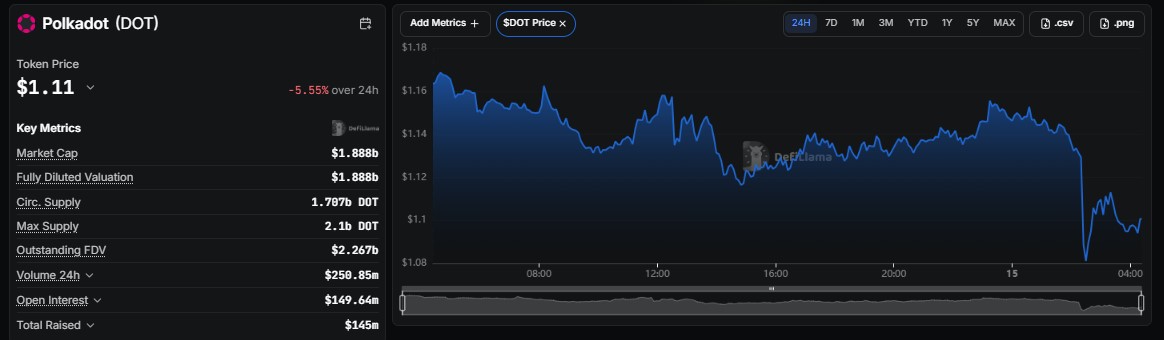
Market cap and fully diluted valuation are both $1.888 billion, with 1.707 billion DOT circulating against a 2.1 billion max supply.
Outstanding FDV is $2.267 billion, and 24-hour trading volume is $250.85 million.
The one-day chart shows DOT sliding from around $1.16 early in the session, bouncing midday, and then dropping sharply late in the window before steadying near $1.10. That quick flush is the backdrop for this DOT price analysis.
DOT Open Interest: Leverage Rebuilds Above the Summer Base
Per Coinglass, DOT open interest sits near $245 million. It held a base around $150 million through June, July, and August, then jumped to roughly $255 million in mid-September as prices recovered above $1.20.
It has stayed in a $200 million to $250 million band since.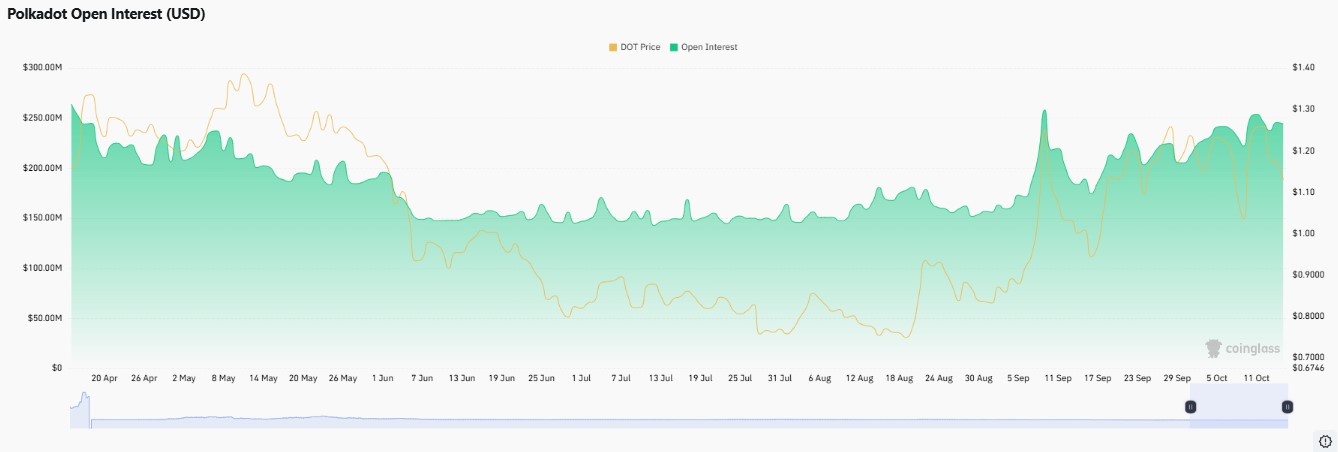
Higher participation alongside a recovering price is constructive, though it also raises liquidation risk if support gives way.
For any Polkadot forecast, that makes the next few daily closes more important than usual.
DOT DAO Strategy: Why dotUSD and User Growth Matter
An X post by MSB Intel says the Polkadot Community Foundation proposed a new DOT DAO strategy that places user growth ahead of TVL and makes dotUSD the favored stablecoin. 
Incentives would go to individual users through on-chain logic, capped per person.
The idea shifts the focus from locked value to real users, which is a notable change in tone for the long-range outlook.
Parity Tests Fully On-Chain App Deployment
A Parity Technologies post on X from 14 October says developers at Web3 Summit 2026 tested an experimental proof of concept using the Playground CLI. 
The flow covered frontend hosting, domain registration, and identity verification, all on-chain, tasks that usually fall back on Web2 infrastructure.
It is an early experiment, but it speaks directly to the builder demand that any decade-long case for DOT depends on.
Polkadot Daily Chart: Ascending Triangle Tests the Rising Trendline
Per TradingView daily chart data, DOT is building an ascending triangle. A flat ceiling near 1.2869 keeps capping rallies, while a rising trendline drawn from the August low near 0.72 keeps catching dips.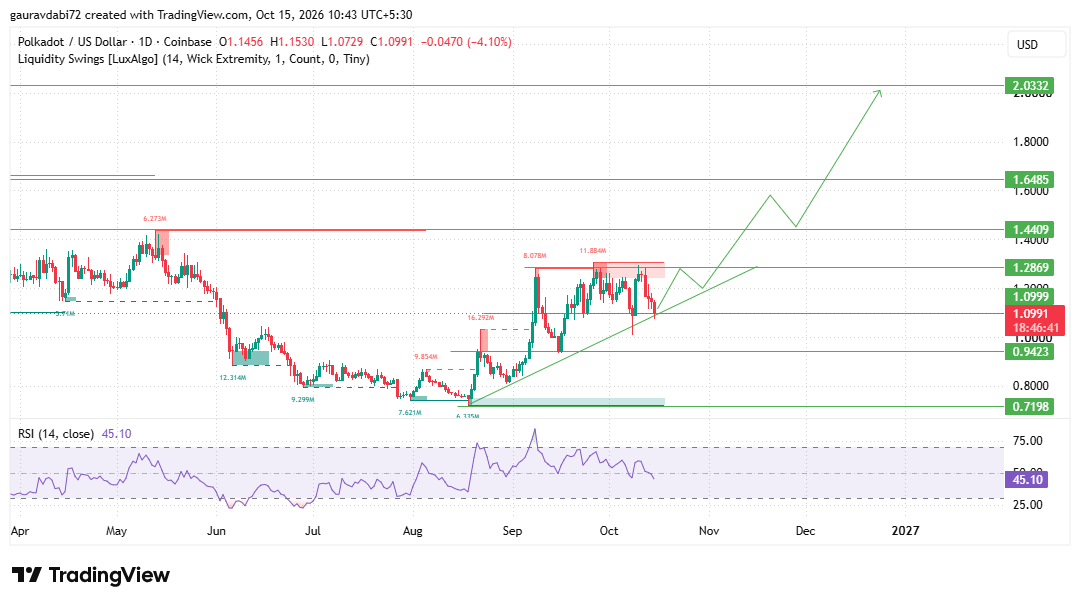
Price is now sliding back toward that rising line around 1.09 to 1.10 after a 4% daily drop.
This is the spot where an ascending triangle either earns its reputation or loses it, so buyers need to show up here.
A daily close above 1.2869 that holds would be a real breakout signal. From there, 1.4409 is the next resistance, then 1.6485, with 2.0332 as the highest chart level.
On the downside, a break of the rising line exposes 0.9423, and a deeper slide would put 0.7198 back in play, the base that started the recovery.
RSI at 45.10 sits just under the midpoint, so momentum has cooled but is not broken.
For an earlier outlook, check our Polkadot Price Prediction 2035 and see how DOT's key levels and market trend have evolved.
Polkadot Network Activity on Subscan
Subscan data shows 33,437,501 finalized blocks, 42,399,697 signed extrinsics, and 39,664,559 transfers. 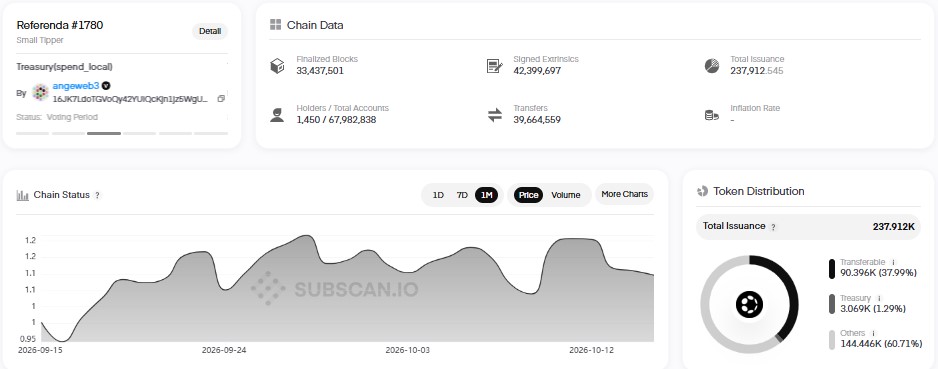
Referendum 1780, a small tipper treasury request, is currently in its voting period.
Steady chain activity and live governance support the Polkadot forecast, though they do not guarantee demand for the token.
Can DOT Break Above $50? What the Math Requires
Start with the numbers. From $1.10, $50 is roughly a 45x move. Today's 1.707 billion circulating supply implies a market cap near $85 billion, or about $105 billion on the 2.1 billion max supply, against $1.888 billion now.
The base case for this Polkadot price prediction 2040 is a slow range between 0.9423 and 1.2869 while the triangle resolves.
The bull case needs a daily close above 1.2869 that holds, then a step-by-step climb through 1.4409, 1.6485, and 2.0332.
The bear case is a break of the rising trendline followed by a close below 0.9423.
Chart levels only map the current cycle, so any $50 view rests on years of user growth and demand that nobody can verify today.
That makes $50 a stretch within any Polkadot forecast.
Key Risks for DOT's Long-Range Outlook
A rejection at 1.2869 would keep the price trapped inside the triangle. A break below the rising line could unwind recent gains quickly, and open interest near $245 million adds liquidation risk.
The DAO proposal may change before it passes, and Bitcoin correlation still guides altcoins.
Analyst Desk View on Polkadot
As per the analyst desk, DOT is sitting at the most important spot of its current structure.
The ascending triangle is intact, the rising trendline is being tested, and RSI has room to turn higher.
Yet the price is still below 1.2869, and a failed hold of the rising line would weaken the Polkadot forecast quickly. A daily close above 1.2869 would be the first clean signal of strength.
Conclusion
The Polkadot price prediction 2040 starts from a neutral but constructive position.
A rising trendline, rebuilt open interest, and a new focus on users and dotUSD support the bullish case, while 1.2869 is the immediate test. Until a daily close above it holds, caution is advised.
Market data in this article was last updated on 15 October 2026.
Disclaimer: This article is for informational and educational purposes only and is not financial advice. Cryptocurrency prices are highly volatile, and long-term price predictions are speculative.





