How Funding Rates, Open Interest, and Liquidations Show Crypto Risk
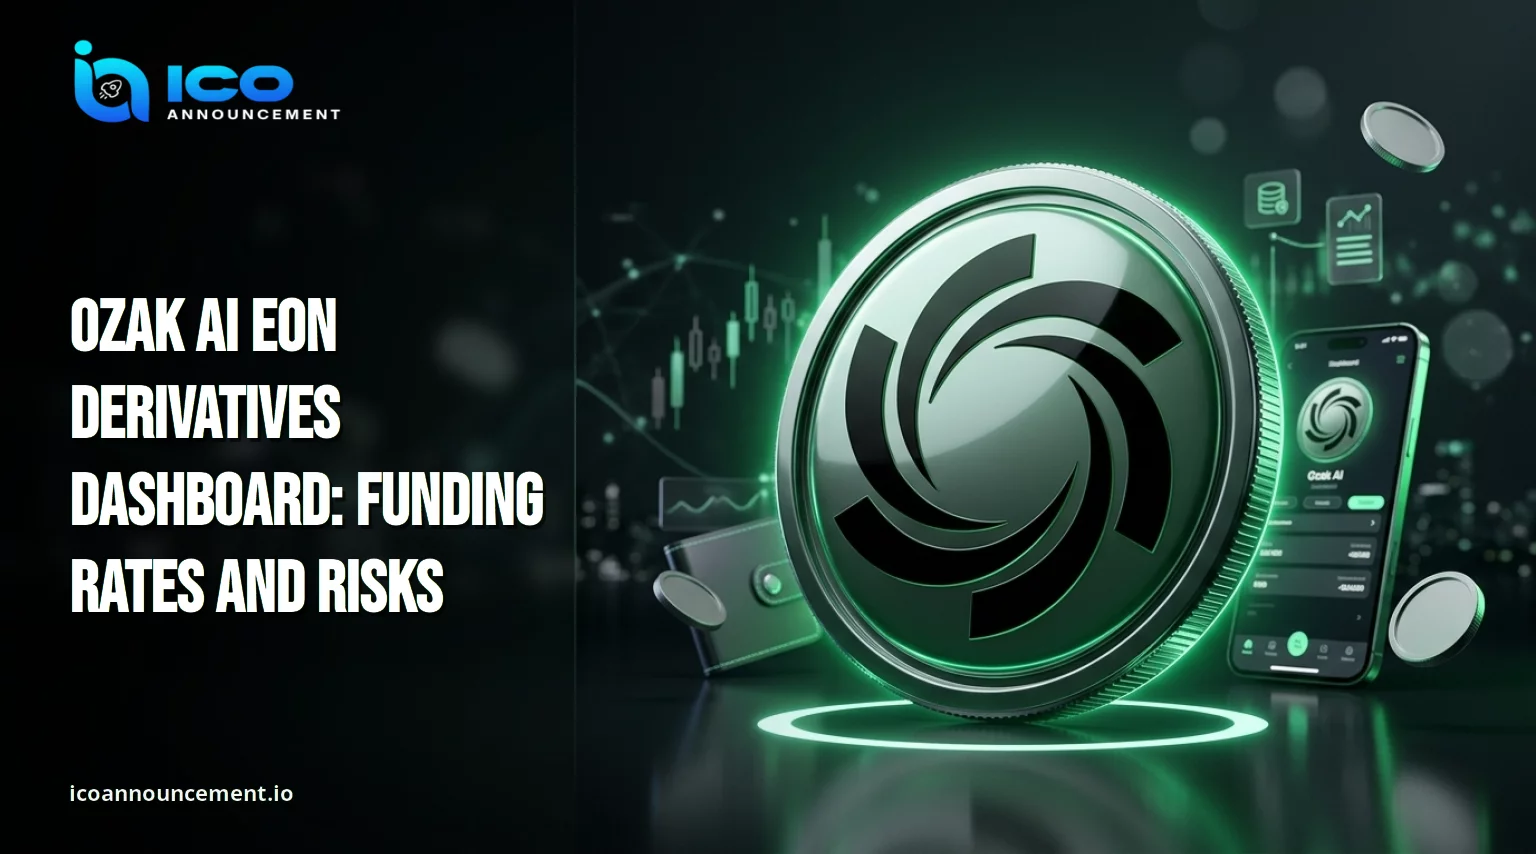
The Ozak AI EON derivatives dashboard puts open interest, funding rates, and liquidation data in one view.
That data is easy to misread. A rising number may mean fresh conviction or fresh danger.
This guide explains what each metric tracks, how to read it, and where the limits sit. It covers derivatives data only. It does not cover buying or claiming OZ tokens.
Key Takeaways
- The dashboard tracks open interest, liquidations, average funding, and exchange-level funding.
- Open interest alone does not predict price direction.
- Positive funding generally means long pay shorts. Negative funding generally means shorts pay longs.
- Liquidations can speed up a move. They do not guarantee a reversal.
- Treat raw data as fact and AI interpretation as one opinion.
- Perpetual trading is listed as a premium feature, so confirm plan access first.
What the Ozak AI EON Derivatives Dashboard Lets Traders Track
Perpetual futures are contracts with no expiry date. Traders add leverage to them, so a small price move creates a large gain or loss.
The platform gathers data on these contracts so users do not hop between exchange screens.
The official documentation says the signals section covers open interest, liquidations, average funding rates, a per-exchange funding breakdown, and divergence between open interest and price.
Perpetual trading is described as a premium feature. Check your plan before relying on any tool.
The platform runs on a layered design with agents and an interface on top. This piece on EON prediction agents explains the forecasting layer behind them.
How Open Interest and Price Divergence Reveal Market Pressure
Open interest counts outstanding contracts that are still live. It is not trading volume.
Volume counts every trade in a period. Open interest counts what remains at the end of it.
A climb in contracts alongside a rising price may mean new money backs the move.
A drop during a rally often means traders are closing out instead. The dashboard flags this gap as divergence.
Divergence is a prompt to look closer. It is not a forecast. The raw count cannot tell you whether the new positions are long or short.
The full list of metrics sits in the official EON signals documentation.
Can Funding Rates Show When Traders Crowd One Side of the Trade?
Perpetual contracts use periodic payments to keep their price close to spot.
When the rate is positive, longs generally pay shorts. When it is negative, shorts generally pay longs.
A very high positive reading hints that many traders lean long.
That crowding raises the risk of a sharp unwind. A reading near zero says little. Treat it as a mood gauge, not a timing tool.
New readers can start with this primer on crypto trading signals.
What Long and Short Liquidations Say About a Possible Reversal
A liquidation happens when an exchange closes a leveraged position because the margin is too thin.
Long liquidations hit traders who bet on a rise. Short liquidations hit traders who bet on a fall.
A large spike speeds up a move. Forced selling pushes the price lower. That triggers more forced selling.
Traders call this chain a cascade. A spike does not guarantee a turn, though. Prices may keep running the same way after the flush.
The way those alerts appear is covered in this EON signals review.
How the Platform Compares Rates Across Crypto Exchanges
Rates are not identical at every venue. Each exchange has its own order flow and its own mix of traders.
According to the official documentation, users see an average plus a per-venue breakdown.
A wide gap between venues points to uneven positioning. A tight cluster suggests traders broadly agree. Compare the spread, not one number.
Then check whether the gap is growing or shrinking over several readings.
How to Read Market Metrics Without Misreading the Signals
Start with context. Then combine metrics. One reading rarely tells the whole story. Try this order:
- Check contract counts against price.
- Read the sign and size of the payment rate.
- Look at the side and size of liquidations.
- Compare venues.
Bullish and bearish labels are shortcuts. A rising price with mild rates looks healthier than the same price with extreme ones. Neither case is a promise.
The platform separates raw data from AI interpretation. Treat the data as fact. Treat the interpretation as one view that needs a second check.
The order-side tools are explained in these EON trading features.
Can Derivatives Signals Be Trusted During High Volatility?
Wild swings stress every indicator. Data may lag. Venues report liquidations in different ways.
Rates shift within hours. An AI summary can sound sure of itself while resting on partial inputs.
Leverage raises the stakes. The official trading documentation lists leverage of up to 40x, margin modes, and take-profit and stop-loss controls.
At 40x, a move of roughly 2.5% against a position erases its margin. Smaller size and a set stop reduce that risk.
The limits of perpetual orders are described in the official EON trading documentation.
Is the Ozak AI EON Derivatives Dashboard Worth Using Every Day?
For research, it can be. It saves time and puts risk data in one place. It will not tell you when to buy or sell. Use it to ask better questions, then confirm on your own charts.
The Ozak AI EON derivatives dashboard works best as a risk lens. Read the numbers, question the story, and keep position size small. No tool removes the chance of loss.
Weigh it against rivals before you commit. This AI trading tools comparison shows where it fits.
Disclaimer
This article is for general information only. It is not financial, investment, legal, or tax advice. Crypto derivatives and leveraged trading carry a high risk of loss, and you can lose your full margin. Nothing here is a price forecast or a promise of profit. Features, plans, and limits change. Check the official pages for current terms before you act. Do your own research and speak with a licensed adviser if you need one.