
Can Ethereum turn a fresh trendline breakout into a decade-long climb, or is the recent pullback an early warning?
The Ethereum Price Prediction 2040 debate depends on whether ETH can hold the ground it has just won and whether new money keeps arriving.
The weekly chart is retesting a key area, and what happens next will shape how realistic a higher long-term path looks.
Ethereum Price Today: Market Stats Behind the 2040 Outlook
Data as of 13 October 2026. Ethereum trades near $2,520, down 1.19% over 24 hours, per DefiLlama data. 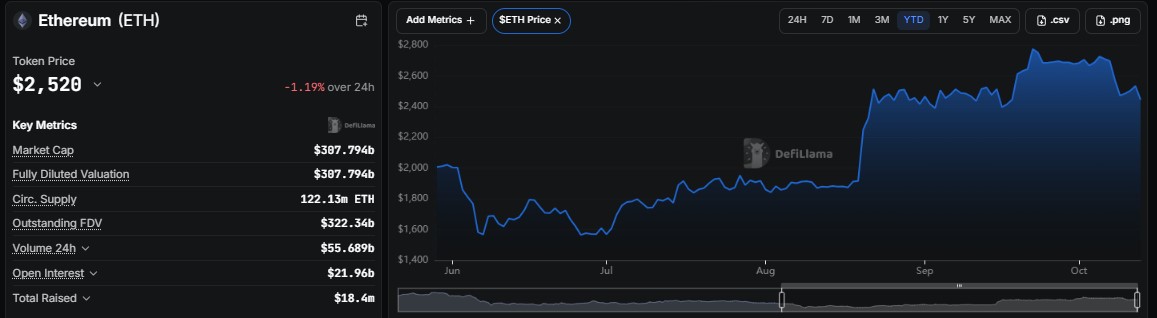
Market cap and fully diluted valuation are both $307.794 billion, with 122.13 million $ETH circulating. Trading volume over 24 hours is $55.689 billion.
The year-to-date view shows a low near $1,570 in June and July, a sharp surge in late August, and a peak near $2,780 in late September before easing back, so this $ETH price analysis starts from a recovery that is being tested.
Ethereum Weekly Chart:
Per TradingView weekly chart data, ETH has broken above a long $ETH descending trendline that began at the cycle high and is now pulling back to retest it. Price trades near $2,494.8, just above support at 2,389.7. 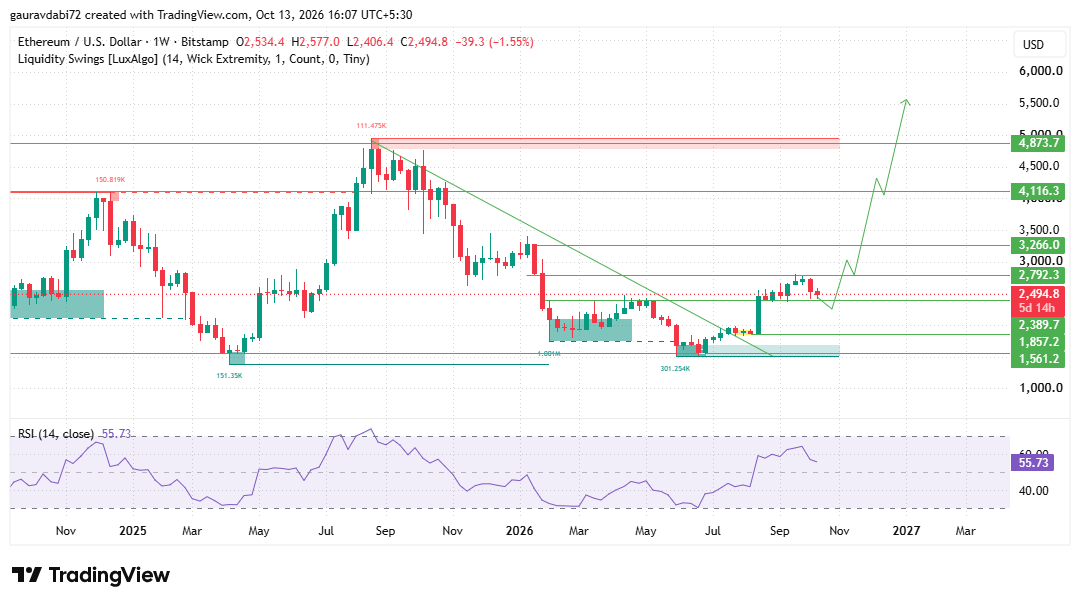
The first hurdle is 2,792.3. A weekly close above it would be a strong follow-through signal and could open room toward 3,266.0, with 4,116.3 and 4,873.7 stacked above as resistance levels from the previous cycle.
On the downside, a loss of 2,389.7 would put 1,857.2 in view, and 1,561.2 is the deeper floor from the summer low.
RSI at 55.73 sits above the midpoint, so momentum is improving but not yet strong.
For an earlier outlook, check out our Ethereum Price Prediction 2035 and see how ETH’s key levels and market trend have evolved.
BlackRock ETF Clients Sell $75 Million of ETH
A post by Whale Insider on X reports that BlackRock ETF clients sold $75.07 million worth of ETH. Outflows from a major fund can weigh on short-term sentiment, though one day of selling does not change the long-term Ethereum forecast on its own.
A Hyperliquid Whale Opens a $60 Million ETH Long
According to a post by The Money Ape on X, a Hyperliquid whale that has won 15 of 15 trades and made $29 million across four wallets has opened a $60 million ETH long. 
A leveraged bet can be closed quickly, so it is a signal to watch and not a floor for price.
Ethereum Network Activity on Etherscan
Etherscan shows about 3.79 billion total transactions at 23.9 TPS, with a median gas price of 0.484 Gwei, or about $0.03.
Daily transactions have moved between roughly 1.5 million and 2 million over 14 days. Low fees and steady usage support the Ethereum Price Prediction 2040 case.
ETH Open Interest: Leverage Jumped With the August Breakout
Per Coinglass, the supplied chart runs to 1 September and shows ETH open interest near $32 billion, up from roughly $26 billion in mid-August as price broke above $2,400. 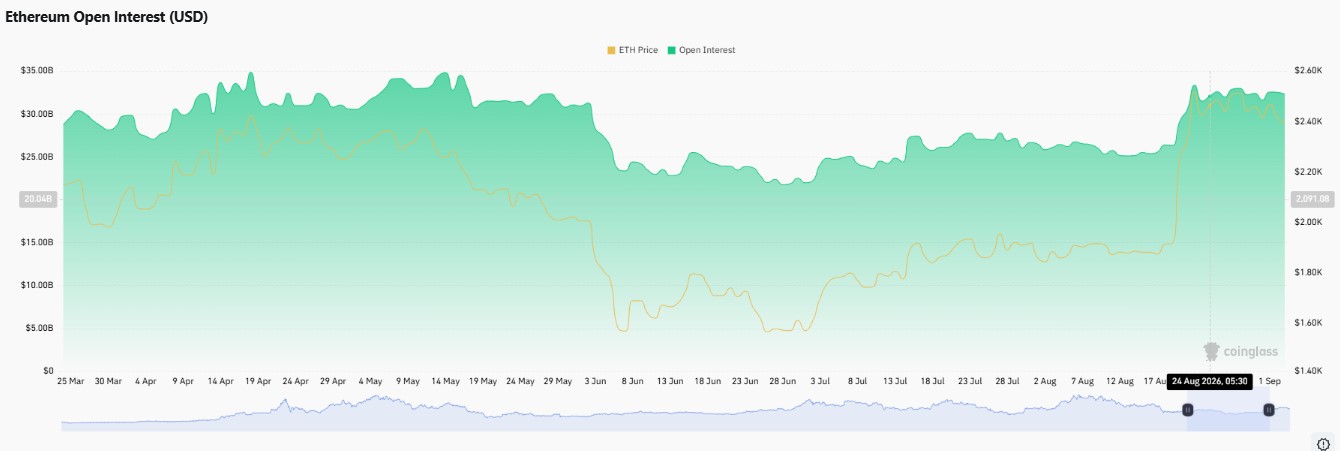
It had dropped to about $22 billion at the June low and sat between $28 billion and $35 billion in spring. Higher leverage raises liquidation risk.
Can ETH Reach $100K? What the Math Requires
Any Ethereum Price Prediction 2040 case that includes $100,000 starts with the math: from $2,520, that is roughly a 40x move.
On today's circulating supply it implies a market cap near $12.2 trillion, against $307.794 billion now, and more than seven times Bitcoin's current market cap of about $1.7 trillion.
That would need a weekly close above 2,792.3, years of institutional demand, and far wider on-chain use.
The base case is a slow climb through the lower resistance levels, the bull case needs the breakout to hold through 4,116.3, and the bear case is a weekly close below 2,389.7.
That makes $100,000 a very distant stretch within any Ethereum forecast.
Key Risks for ETH's Long-Range Outlook
A weekly close below 2,389.7 would turn the breakout into a failed retest. ETF outflows can continue, a leveraged whale position can reverse, and higher open interest raises liquidation risk. Bitcoin correlation also still guides altcoins.
Analyst Desk View on Ethereum
As per the analyst desk, ETH has done the hardest part by breaking a long downtrend, but the retest is not finished. Support at 2,389.7 is clear, and RSI is healthy, yet price remains below 2,792.3, and fund flows are mixed.
A confirmed weekly close above that level would be the first clean signal that the Ethereum forecast is strengthening.
Conclusion
Ethereum enters the road to 2040 from a recovering but unconfirmed position. The trendline breakout, low fees, and large whale conviction support the bullish case, while ETF outflows and the open retest keep the risks real.
For the Ethereum Price Prediction 2040 thesis to gain weight, the price needs to hold 2,389.7 and close above 2,792.3.
Disclaimer: This article is for informational and educational purposes only and is not financial advice. Cryptocurrency prices are highly volatile, and long-term price predictions are speculative.