

Ethereum price prediction models are watching one thing: a tightening channel that won't stay quiet much longer.
Ethereum Price Prediction Today
Data snapshot: September 10, 2026, 14:32 UTC.
The 24-hour range ran between $2,443.70 and $2,520.34. Tight, by ETH standards.
ETH still holds the number-two spot by market cap across wider crypto asset categories. Price remains roughly half of its all-time high of $4,953.73, set August 25, 2025.
Ethereum Price Prediction at a Glance
Bull Case
A confirmed trading move above $2,587 opens a path toward $3,195, then $4,203.
ETF inflows and treasury buying supply the catalyst. Momentum across new crypto presale listings hints risk appetite is returning market-wide, and that tends to lift ETH once sentiment turns.
Invalidation sits below $2,222.
Base Case
Range-bound trading between $1,905 and $2,587 stays the likely path for now. Activity across ongoing crypto ico rounds suggests capital isn't fully committed either direction yet, and consolidation inside the ascending channel needs steady volume to hold.
Nothing breaks until one side gives up.
Bear Case
Losing the $1,905 zone opens downside toward $1,505. A macro liquidity squeeze, or a repeat of what hit BFX support break signals, could trigger it. And that would invalidate the current bullish structure entirely.
That's the downside, math.
Ethereum Technical Analysis
ETH Trend Analysis
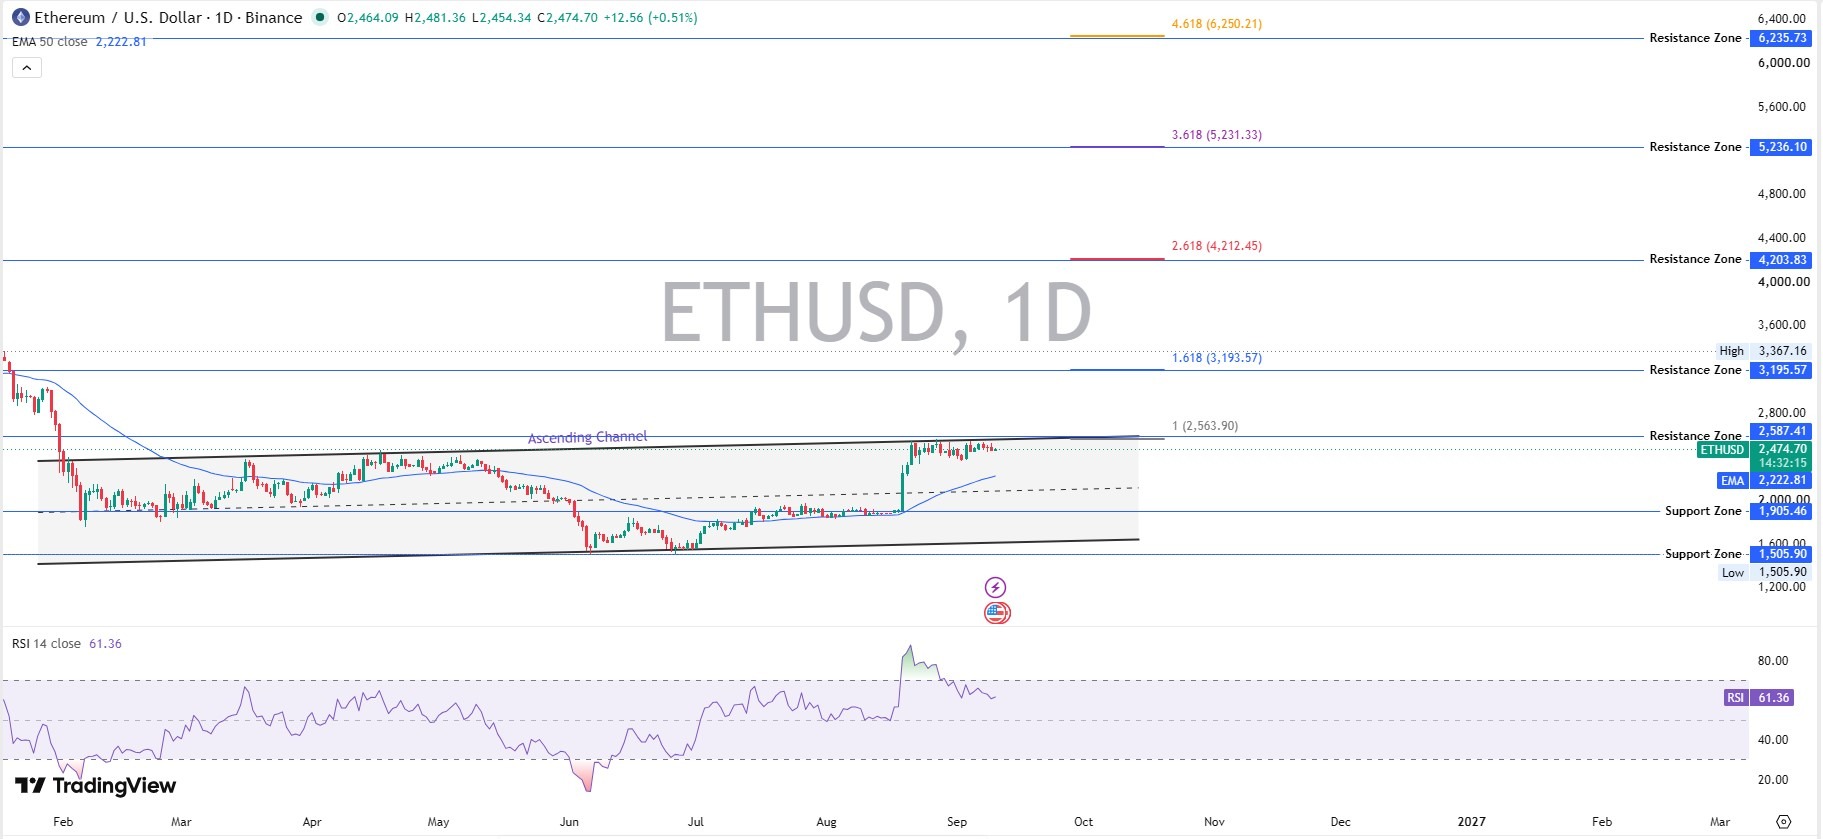
Daily candles hold above the rising trendline, with trading activity near $2,474 and the 50-day EMA close to $2,222 acting as a floor. Near-term price action stayed inside a tight $2,443 to $2,520 band over the past 24 hours.
Monthly structure still favors buyers over sellers. But the higher-timeframe RSI near 49.32 shows the long trend cooling, a pattern that recently played out ahead of XRP's breakout zone too.
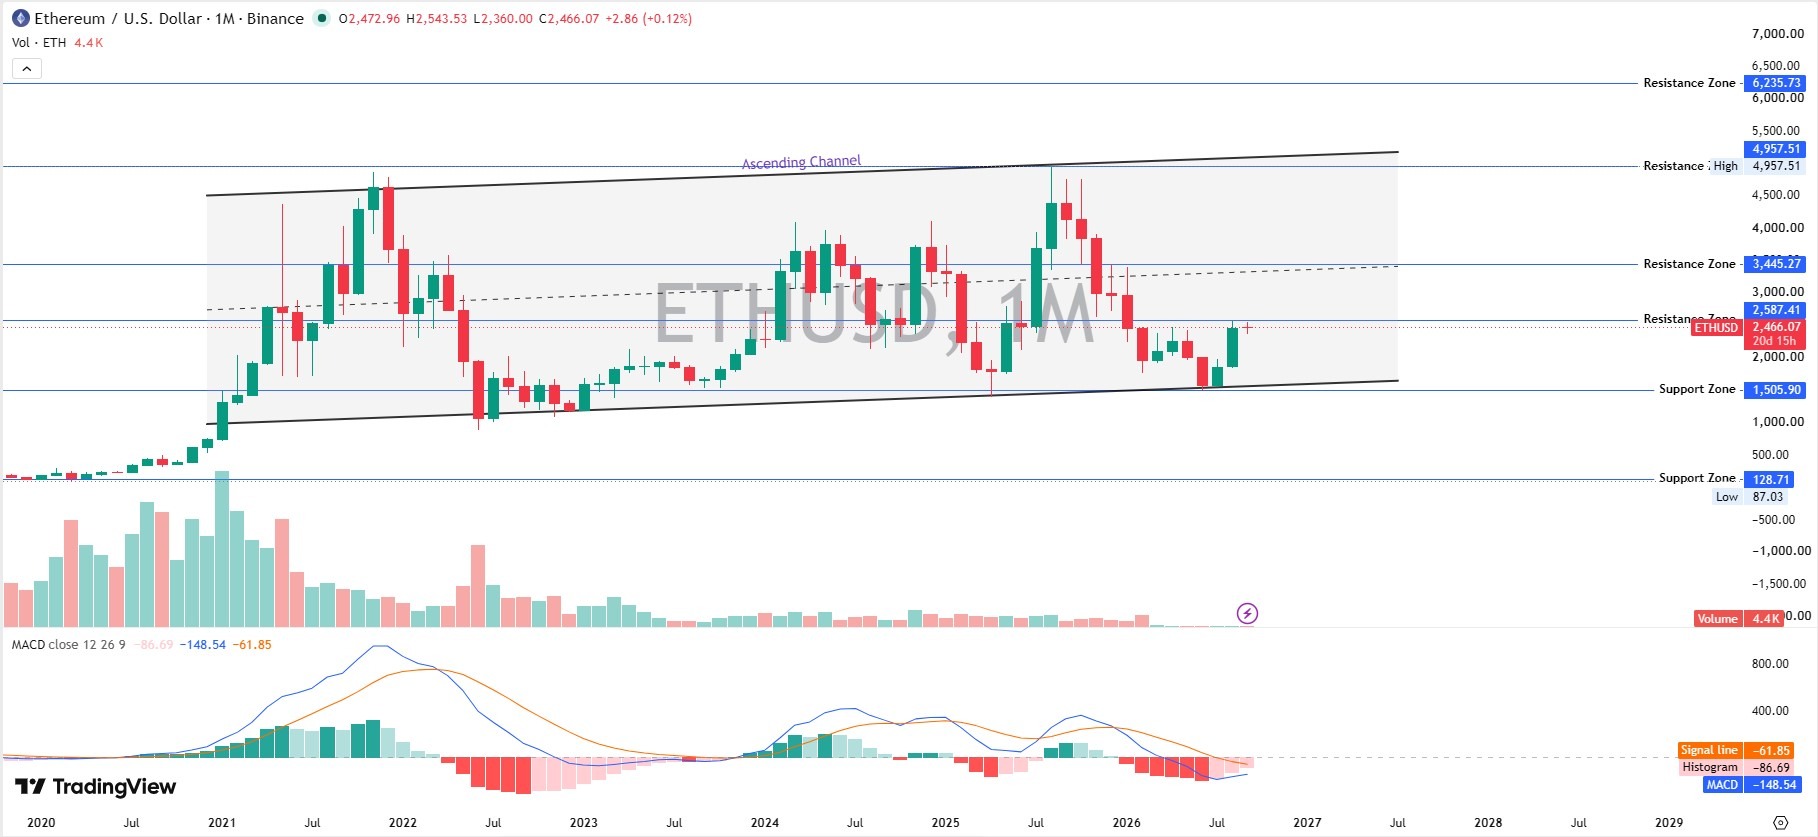
Short-term structure looks firmer than the long-term one. That gap matters more than it should.
Ethereum Support Levels
S1 → S2 → S3 $2,222 → $1,905 → $1,505
Ethereum Resistance Levels
R1 → R2 → R3 $2,587 → $3,195 → $4,203
A further stretch zone sits near $6,235, tracked through the same broad market lens as active IDO markets watch new supply unlocks.
RSI Analysis
Daily RSI reads 61.36. Neutral-to-bullish, not overbought. Monthly RSI sits closer to 49, right at the midline.
Momentum isn't stretched either way yet. Here's the thing: neutral readings rarely stay neutral for long.
MACD Analysis
Daily MACD sits at 94.34 against a signal line of 113.08, with the histogram at negative 18.74. That's a soft bearish crossover inside a bigger uptrend.
Monthly MACD stays negative near negative 86.69. Fading momentum on the higher frame, even while price holds up, deserves attention, especially with regulatory noise building around newer fundraising routes like IEO fundraising trends.
Volume Analysis
Trading volume across major venues hit roughly $28.5B in the past day. Binance alone processed over $10.7B, according to broader crypto market coverage tracking exchange-level flow.
Confirmation looks decent. Not explosive.
ETH Breakout and Breakdown Scenarios
What Happens Above Resistance?
Breakout above $2,587, daily confirmation, then a target near $3,195. Extended follow-through opens $4,203.
What Happens Below Support?
Breakdown below $1,905, confirmation on retest, then a downside target near $1,505.
ETH Invalidation Level
Invalidation Level: $1,505 A sustained trading move below this zone breaks the multi-year ascending channel and flips the structural bias bearish.
Ethereum Price Prediction 2026-2030
Ethereum Price Prediction 2026: Base $2,400 implies a cap near $293B, roughly flat versus today. Bear $1,505 marks a $184B cap if $2,222 support fails. Bull $4,203 needs a $513B cap plus a confirmed breakout above $2,587.
Ethereum Price Prediction 2027: Base $2,900 puts the cap near $354B, tied to sustained ETF demand. Bear $1,200 marks a $146B cap in a deeper macro downturn. Bull $5,236 needs a $639B cap and steady treasury accumulation.
Ethereum Price Prediction 2028: Base $3,500 equals a $427B cap, tied to Layer-2 growth and the Hegotá upgrade. Bear $1,900 reflects a $232B cap if burn can't keep pace. Bull $6,200 needs a $757B cap and wider stablecoin-gas use.
Ethereum Price Prediction 2029: Base $4,300 equals a $525B cap, roughly 1.7x today's valuation. Bear $2,600 marks a $317B cap if the wider Bitcoin cycle turns weak. Bull $7,200 needs a $879B cap and deeper institutional buying.
Ethereum Price Prediction 2030: Base $5,236 implies a $639B cap, built on steady adoption. Bear $3,445 marks a $420B cap even in a conservative scenario. Bull $8,200 needs a trillion-dollar cap and real tokenization scale.
What Could Drive ETH Higher?
Ethereum ETF Flows
Cumulative net inflow into United States spot ETH ETFs reached $13.20B, per spot Ethereum ETF tracking data, with total net assets near $15.69B, about 5.20% of ETH's market cap. Daily net inflow on September 9, 2026, 09:00 UTC came in at $34.75M.
That's not nothing.
Institutional Adoption
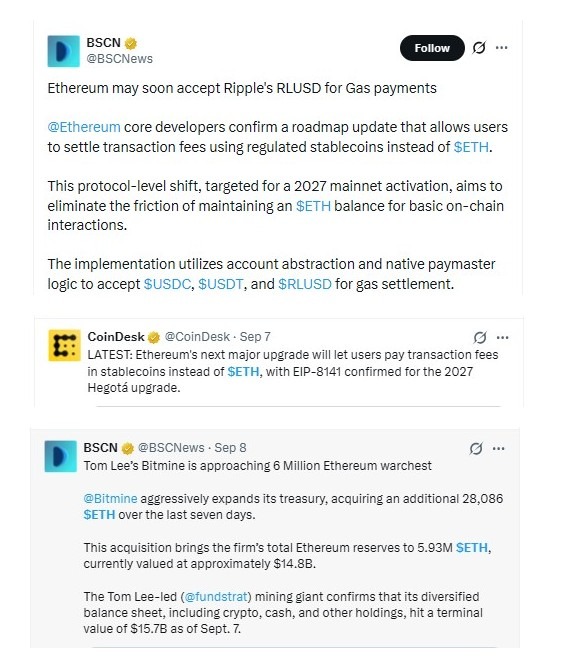
Tom Lee's Bitmine added 28,086 ETH over seven days, per a Bitmine treasury update, pushing total holdings near 5.93M ETH, worth roughly $14.8B. When we pulled up the treasury numbers, the pace stood out immediately.
Stablecoin Growth
More stablecoin settlement on Ethereum rails supports base-layer demand, even as fee mechanics keep shifting under it.
Tokenization
Real-world asset tokenization keeps choosing Ethereum as a settlement layer. Slow-burn catalyst. Not a quick one.
Layer-2 Growth
Rising Layer-2 activity brings users in, though it complicates direct fee capture back on the base chain.
ETH Network Upgrades
The planned 2027 Hegotá upgrade, including EIP-8141, would let users pay gas in stablecoins like USDC, USDT and RLUSD instead of ETH. It's a friction-removal move, not a demand driver on its own.
ETH Supply and Burn
Burn mechanics still remove ETH from circulation during high-activity periods, tightening float over time.
What Could Push Ethereum Lower?
Bitcoin Weakness
Bitcoin trades near $77,981, down 1.31% over 24 hours, with daily RSI at 58.19, a setup worth tracking alongside Bitcoin's own whale positioning near its decision point. A deeper BTC slide tends to drag the whole market down with it.
Macro Liquidity
Tighter global liquidity conditions hit risk assets first. Crypto isn't exempt.
ETF Outflows
Daily ETF flow data has flipped negative on several days this month, including a $24.29M outflow logged September 8, 2026. Swing factor to watch.
Regulatory Risk
Shifting rules around stablecoins and gas-fee mechanics add uncertainty heading into 2027.
Layer-2 Fee/Value-Capture Concerns
As more activity moves to Layer-2 networks, base-layer fee revenue could shrink.
Competition From Other Chains
Rival smart-contract platforms, tracked across rival blockchain networks, keep pulling developer attention and liquidity away from Ethereum's base layer.
ETH On-Chain Analysis
Holder concentration data shows the top 100 addresses controlling roughly 70.11% of one tracked ETH-pegged token's supply, per on-chain holder distribution data. Whale wallets, just 0.02% of holders, control over 77.44% of that supply. Concentrated. That's the word for it.
Liquidation data adds context. Twenty-four-hour liquidations hit $50.74M, split between $43.36M in long positions and $7.38M in shorts, per Ethereum liquidation tracking data. Long traders took the bigger hit, and that alone tells part of the story: margin-heavy upside bets got flushed harder than downside ones.
Bitcoin vs. Ethereum Correlation
Bitcoin's trend still sets the tone for most altcoin trading, ETH included. When BTC weakens, altcoin liquidity often dries up fast.
ETH tends to outperform BTC during risk-on phases, once Bitcoin dominance starts slipping. But when Bitcoin breaks support hard, ETH usually follows within hours, not days.
Disclaimer
This article is for informational purposes only and does not constitute financial, investment, or trading advice. Cryptocurrency markets are highly volatile, and price predictions are scenario-based estimates, not guarantees. Independent research and consultation with a qualified financial advisor is recommended before making any investment decision.