

Is Bitcoin still early in a much longer cycle, or is the market running ahead of itself?
Bitcoin price prediction 2050 sits at the far end of that debate, and the weekly structure shows a market rebuilding after a rough stretch. Buyers have started to push back, but the next decision zone is already close.
The real question is whether this recovery can turn into a base strong enough to carry BTC through the next two decades.
Bitcoin Price Today: Market Cap, Volume, and Supply
BTC was trading near $81,981 per DefiLlama data, up 1.54% over 24 hours. 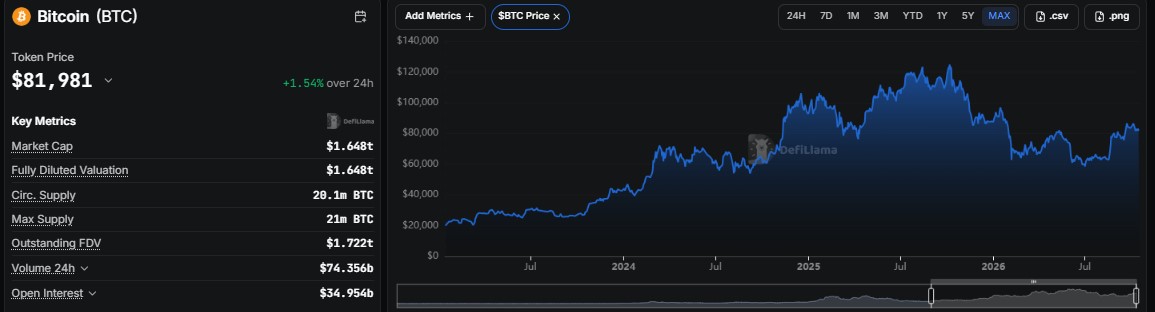
Market cap and fully diluted valuation both sit around $1.648 trillion, while 24h trading volume is about $74.356 billion.
Circulating supply is close to 20.1 million BTC against a hard cap of 21 million, and the Blockchain.com explorer lets readers check supply and network activity directly. 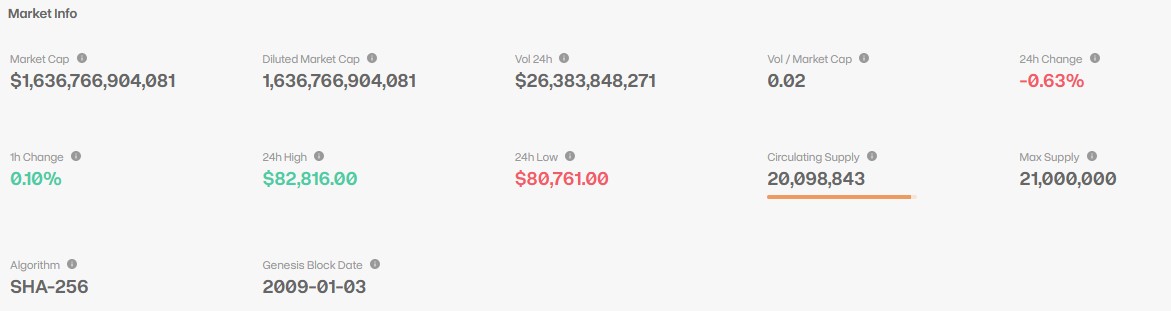
Separate market data puts the 24h range between $80,761 and $82,816, a tight band for a coin of this size.
Data as of 17 October 2026.
Is Bitcoin Open Interest Supporting the Recovery?
According to Coinglass, BTC open interest is hovering near $52 billion. That is well below the spike above the 40 billion zone where it spent much of the summer, when the price was bottoming near $60K. 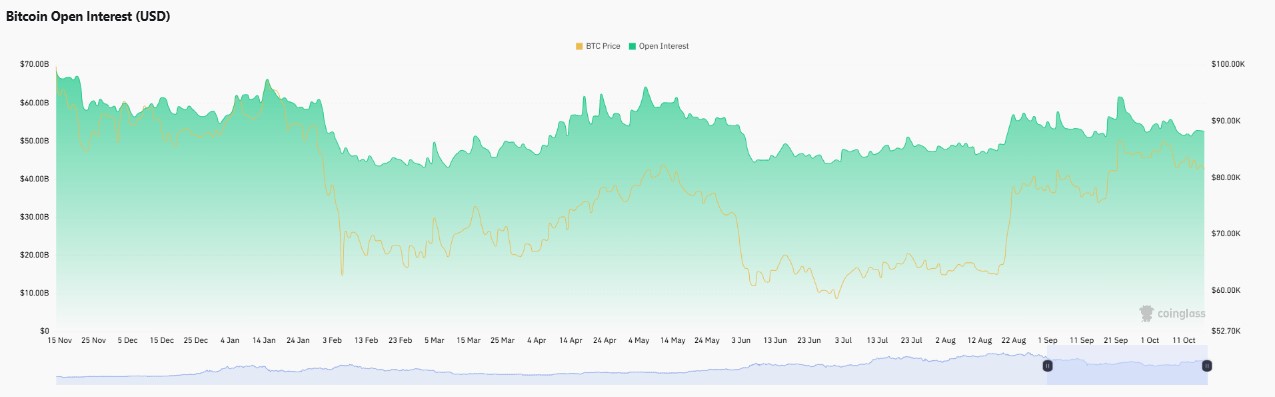
So the climb back into the low $80Ks came with fresh leverage rather than a thin, empty bounce.
That cuts both ways. Rising open interest beside a steady price can feed a clean breakout, but crowded positioning also raises the odds of a sharp flush if support gives way.
BlackRock, IBIT and Bitcoin ETF Inflows
BSCN on X asked who actually owns the Bitcoin held by BlackRock. The answer: the iShares Bitcoin Trust (IBIT) holds BTC so investors get exposure without managing private keys, but BlackRock is not the personal owner of all the coins in the fund. 
It is a useful reminder that ETF demand is investor demand wrapped in a custody structure.
The Money Ape reported that BlackRock clients started aggressively buying BTC and ETH dips, roughly $60 million worth, while Fed rate hike odds slipped below 15%. 
The post's guess about a Trump move before the midterms is speculation, so the macro angle is better read as sentiment than confirmed fact.
Bitcoin Weekly Chart Analysis: Double Bottom Near Resistance
On the weekly chart, per TradingView, Bitcoin has built a double bottom formation with a pair of lows around the 60,274 zone. 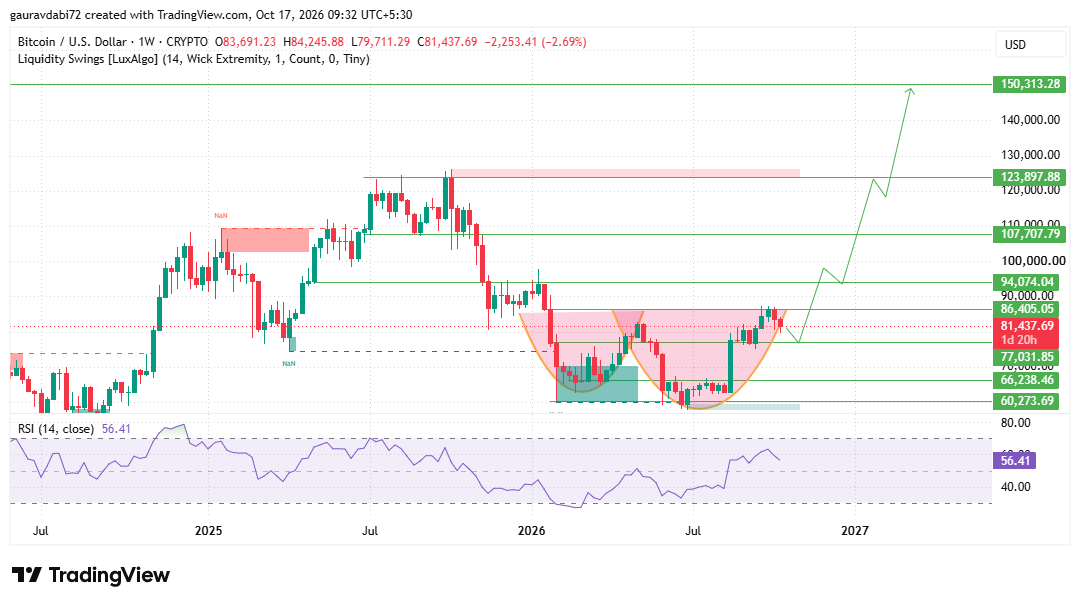
Price has since climbed back into the neckline area, and 86,405 is the key resistance where the latest advance stalled.
The current weekly candle has swung between 84,246 and 79,711 and sits near 81,437, which is the immediate support to watch.
A weekly close above 86,405 that holds would confirm the pattern and open the path toward 94,074, then 107,708 and 123,898. If 81,437 fails, the chart's own pullback path points to a retest of 77,032, with 66,238 and 60,274 as deeper floors.
RSI at 56.41 is in neutral territory with room to rise, though momentum has cooled. Volume and derivatives support will decide whether a break holds or fades.
For an earlier outlook, check out our Bitcoin Price Prediction 2040 and see how BTC’s key levels and market trend have evolved.
Can BTC Reach $50 Million by 2050? The Long-Term Bitcoin Forecast
Here is the math behind the headline. A price of $50 million per coin would imply a market cap near $1 quadrillion on roughly 20.1 million coins, about 610 times today's $1.648 trillion.
Over 24 years, that works out to roughly 31% growth every single year. No weekly chart can validate that, so this Bitcoin forecast keeps two tracks apart: what the structure supports now and what the 2050 headline would require.
The chart's highest marked level, 150,313, is the realistic stretch for this cycle if the double bottom resolves higher.
Anything beyond that depends on adoption, institutional demand, and Bitcoin's monetary role holding up for decades.
This Bitcoin price prediction 2050 stays conditional for that reason.
Key Risks for Bitcoin
A rejection at 86,405 would turn the neckline into a ceiling and drag price back toward 81,437.
Loss of 81,437 could trigger a leverage flush, given open interest near $52 billion.
Cooling ETF demand or a shift in Fed expectations could remove the buying seen on recent dips.
A $50M outcome rests on assumptions that stretch over 24 years and cannot be tested today.
Expert Opinion
As per the analyst desk, the 86,405 weekly level is the make-or-break area. A confirmed close above it, backed by volume and healthy open interest, would turn the bullish structure into a trend with real follow-through.
Until then, the setup is constructive but unproven, and the $50M headline belongs in the thought-experiment column rather than the trading plan.
Readers who want the broader view can compare this Bitcoin forecast against shorter-horizon outlooks.
Conclusion
Bitcoin price prediction 2050 asks a question the weekly chart cannot answer on its own.
What it can show is a double bottom pressing against 86,405, with 81,437 as the line buyers must defend.
A hold and close above resistance opens 94,074 and higher, while a breakdown sends price back toward 77,032.
The path to $50M is a long-horizon scenario, while the nearer levels are where the real decisions get made.
Disclaimer: This article is for informational and educational purposes only and is not financial advice. Cryptocurrency prices are volatile, and long-term projections are speculative. Always do your own research before making any investment decision.





