Is Solana quietly rebuilding while the crowd looks elsewhere? After a punishing slide that dragged it far below its earlier highs, SOL has started climbing again with a steadiness that looks deliberate rather than hopeful.
That shift explains the growing interest in Solana Price Prediction 2027, and why traders are asking whether old highs can come back into view. The answer depends on a few levels and on whether real-world adoption gives buyers a reason to stay.
How Has Solana Performed in 2026 So Far?
The token has clawed back most of its year. Coinglass data shows SOL down just 5.00% year to date, even though the one-year figure still reads -44.49%. 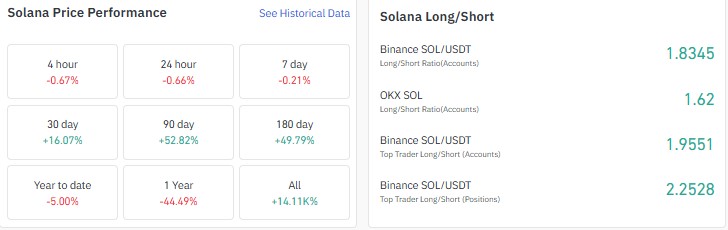
The recent run explains the gap: 30-day gains of 16.07%, 90-day gains of 52.82%, and 180-day gains of 49.79%.
CoinGlass lists the Binance SOL/USDT account long-short ratio at 1.8345, OKX at 1.62, and Binance top traders at 1.9551 by accounts and 2.2528 by positions, meaning larger players are the most confident.
Per TradingView chart data, the price bottomed near the 61.08 zone in mid-year and now sits roughly 95% above it, with the latest monthly candle up about 15.04%.
Solana Price Today: Market Cap, Supply and Trading Volume
SOL trades near $118.86 with a market cap of $69.74 billion on 588.00 million circulating coins, according to Coinglass. 
Solscan counts the full 634.92 million supply and values the network near $75.56 billion at roughly $119. 
Futures volume over 24 hours hit $8.02 billion against $761.03 million in spot, so derivatives trading is more than ten times heavier than spot.
Are Solana Traders Leaning Long? Ratios and Liquidations
Day-to-day moves are muted: SOL is down 0.67% over four hours, 0.66% over 24 hours, and 0.21% across seven days. Positioning leans long without looking extreme. 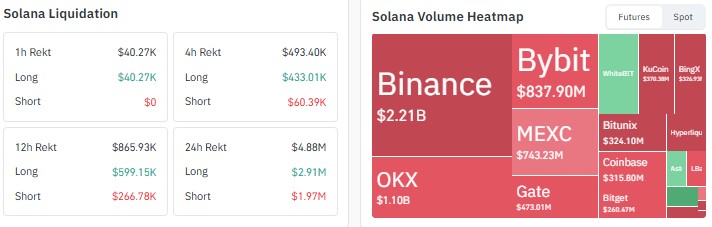
Of the $4.88 million liquidated in 24 hours, longs made up $2.91 million and shorts $1.97 million. The signal is mixed but healthy, with no crowded bet waiting to unwind.
Is Leverage Returning to Solana? Open Interest Explained
Coinglass puts SOL open interest at $7.06 billion, and its chart recorded $7.10 billion on 30 September with a price at $119.07.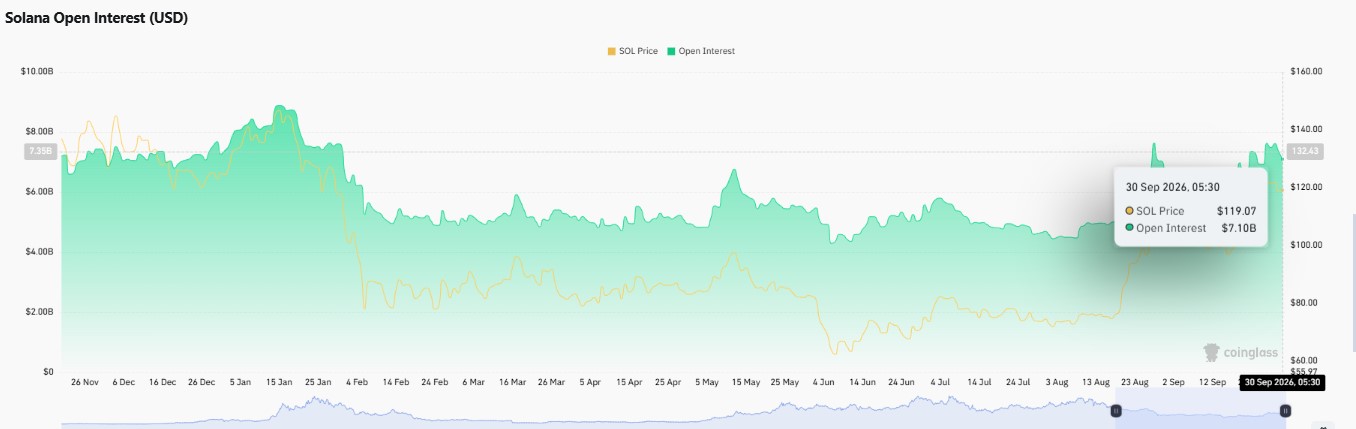
That is a sharp rebuild from roughly $4.5 billion in early August, when price hovered in the $80 range.
It still trails the near $8.9 billion peak seen in mid-January, so traders are back but not yet euphoric.
Why Does Metaplex's MPL-3643 Matter for Solana?
According to an X post by Solana, Metaplex has introduced MPL-3643, a standard for issuing real-world assets and tokenized securities natively on the network with built-in compliance. 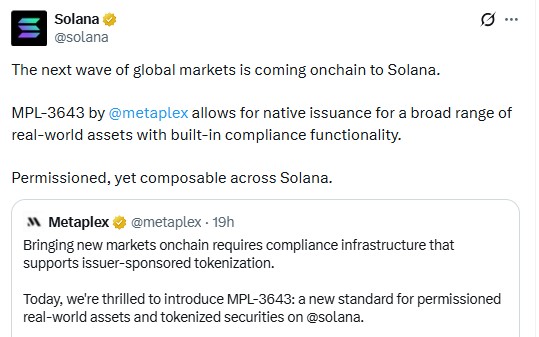
The post describes it as permissioned yet composable across Solana.
Such infrastructure could attract institutional interest, though the post gives no adoption figures, so the price impact remains an open question.
Solana Weekly Chart Analysis:
For most of 2026, SOL drifted lower inside a descending channel. Per TradingView, an August weekly candle blasted out of it and reclaimed 96.02 and 82.38, turning both into a demand zone for pullbacks.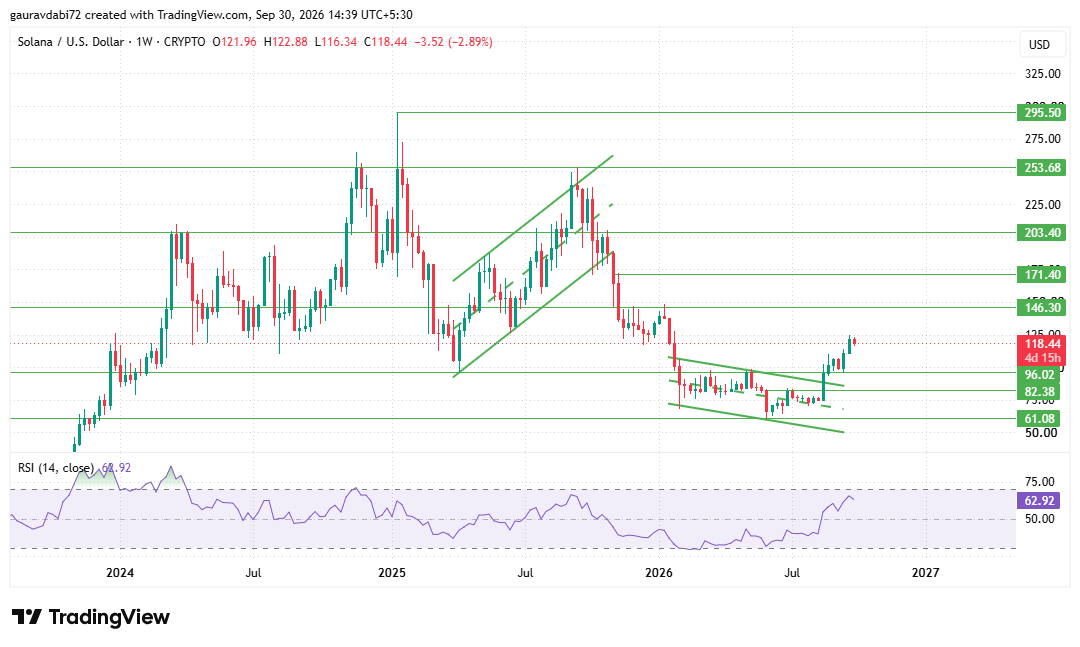
The bullish structure has held since, with weekly RSI near 62.92 showing strength without overheating.
The latest candle slipped about 2.89%, which looks like a breather. The next big hurdle is 146.30, about 23% higher, and a weekly close above it would open the way toward 171.40.
Solana Monthly Chart: What Does the Rounding Bottom Suggest?
On the higher timeframe, TradingView shows a rounding bottom forming as monthly candles curved from the 61.08 low back toward the rim.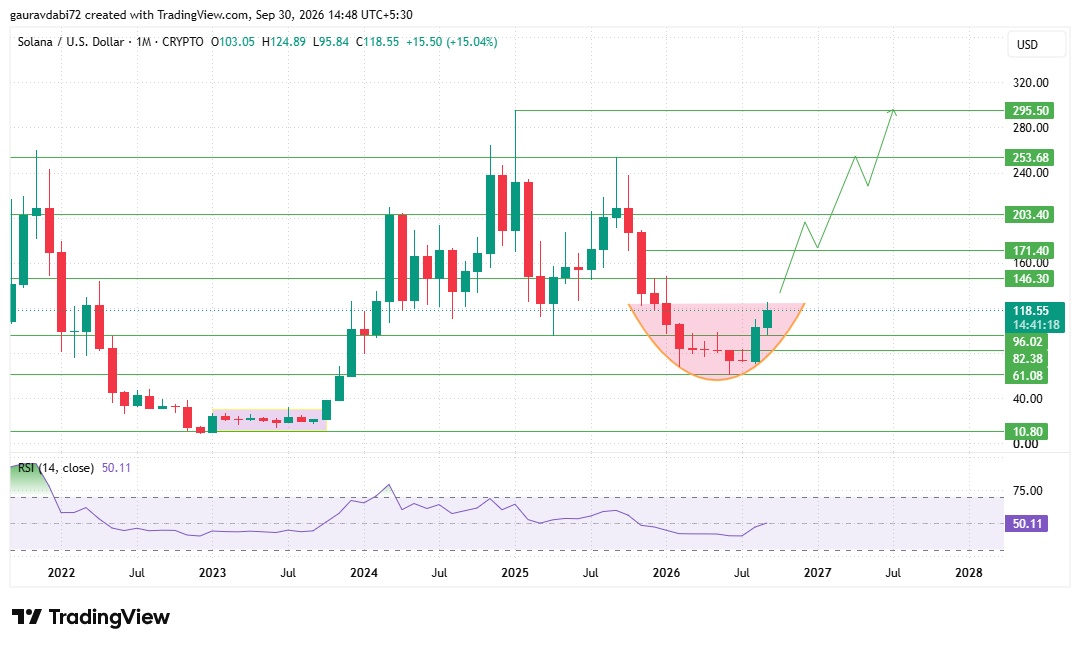 That pattern often marks a slow transition from sellers to buyers, and monthly RSI at 50.11 confirms momentum has only just turned neutral.
The immediate resistance sits at 146.30, followed by 171.40, 203.40, 253.68, and 295.50, the last being the previous cycle high.
Below, 96.02, 82.38, and 61.08 form the SOL support and resistance levels that shape the downside.
The 10.80 area is the far-off 2023 base and matters only in a full structural collapse.
The projected path on the chart climbs in stages toward 295.50 by mid-2027.
What Must Happen for SOL to Retest Its Old Highs?
Buyers first need a weekly close above 146.30 that does not immediately fade. Open interest should keep rebuilding toward January's levels, backed by spot volume that is still small next to $8.02 billion in futures.
Top-trader positioning should stay constructive without stretching. Finally, the tokenization story needs to translate into real issuance on the network, since headlines alone rarely sustain a rally.
Solana Price Prediction 2027: Bear, Base, and Bull Paths
From about $118.86, 146.30 sits 23% higher, 203.40 about 71% higher, and 295.50 roughly 149% higher, so the Solana price prediction 2027 leans constructive if support holds.
Reaching 295.50 would imply a market cap near $174 billion at current circulating supply, against $69.74 billion today.
That is possible only with sustained inflows, which is why the top of the range is best treated as a bull-case outcome, not a base case.
What Could Stall the $SOL Rally?
A rejection at 146.30 could send SOL back toward 96.02, roughly 19% below.
The 44.49% one-year loss shows how fragile recoveries have been, and futures volume more than ten times spot leaves room for sharp leverage swings.
Open interest also remains below its January peak, and a Bitcoin-led risk-off move would weigh on SOL too.
Expert Opinion: Is $SOL Building a Durable Base?
As per the analyst desk, the recovery shows unusual alignment: a channel breakout on the weekly chart, a rounding bottom on the monthly chart, measured long positioning, and a fresh tokenization narrative.
What is missing is proof that adoption converts into demand.
If 96.02 holds and 146.30 gives way, the 171.40 to 203.40 zone looks realistic in 2027, while 295.50 would need a much stronger cycle.
Conclusion
The token has rebuilt its structure from the 61.08 low, and the Solana price forecast 2027 looks constructive as long as pullbacks stay above 96.02. Levels are mapped up to 295.50, and the first test is 146.30.
Disclaimer: This article is for informational purposes only and is not financial advice. Cryptocurrency prices are highly volatile, so readers should assess their own risk tolerance before making any decision.